Graphics Reference
In-Depth Information
twoway (scatter ownhome pcturban80) (
lfit
ownhome pcturban80)
(
qfit
ownhome pcturban80)
It is sometimes useful to overlay fit
plots to compare the fit values. In this
example, we overlay a linear fit
lfit
and quadratic fit
qfit
and can see
some discrepancies between them.
Uses allstatesdc.dta & scheme vg s2c
20.0
40.0
60.0
80.0
100.0
Percent urban
% who own home
Fitted values
Fitted values
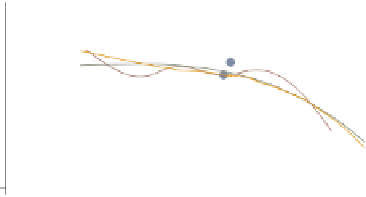
twoway (scatter ownhome pcturban80) (
mspline
ownhome pcturban80)
(
fpfit
ownhome pcturban80) (
lowess
ownhome pcturban80)
Stata supports a number of other fit
methods. Here, we show an
mspline
(median spline) overlaid with
fpfit
(fractional polynomial fit) and
lowess
.
Another similar command, not shown,
is
mband
(median band).
Uses allstatesdc.dta & scheme vg s2c
20.0
40.0
60.0
80.0
100.0
Percent urban
% who own home
Median spline
predicted ownhome
lowess ownhome pcturban80
2.3
Regression confidence interval (CI) fits
This section focuses on the twoway commands that are used for displaying confidence
intervals around fit values:
lfitci
,
qfitci
,and
fpfitci
. The options permitted by these
three commands are virtually identical so we will use
lfitci
to illustrate these options.
(Note, however, that
fpfitci
does not permit the options
stdp
,
stdf
,and
stdr
.) For
more information, see [
G
]
graph twoway lfitci
,[
G
]
graph twoway qfitci
, and [
G
]
graph
twoway fpfitci
.
The electronic form of this topic is solely for direct use at UCLA and only by faculty, students, and staff of UCLA.