Graphics Reference
In-Depth Information
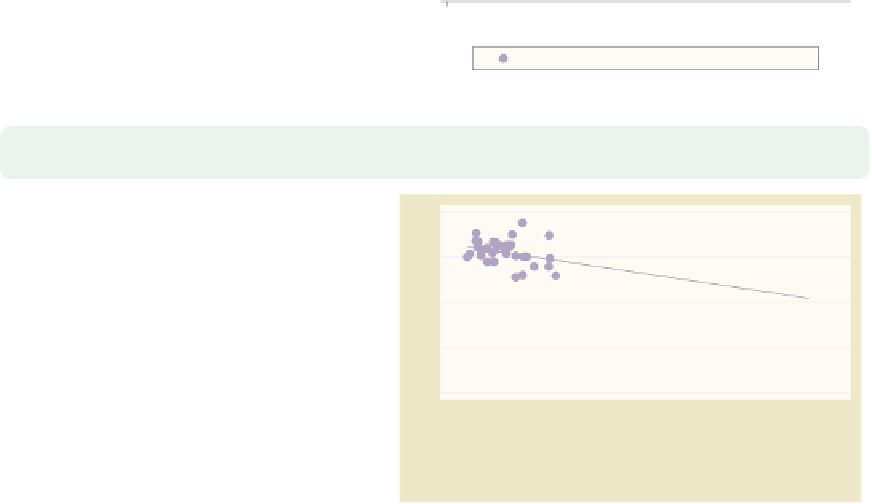
twoway scatter fv ownhome propval100, msymbol(i .)
connect(l i)
sort legend(label(1 Pred.
Perc.
Own)
order(2 1)
)
The
order()
option can be used to
specify the order in which the items in
the legend are displayed.
Uses allstates.dta & scheme vg past
0
20
40
60
80
100
% homes cost $100K+
% who own home
Pred. Perc. Own
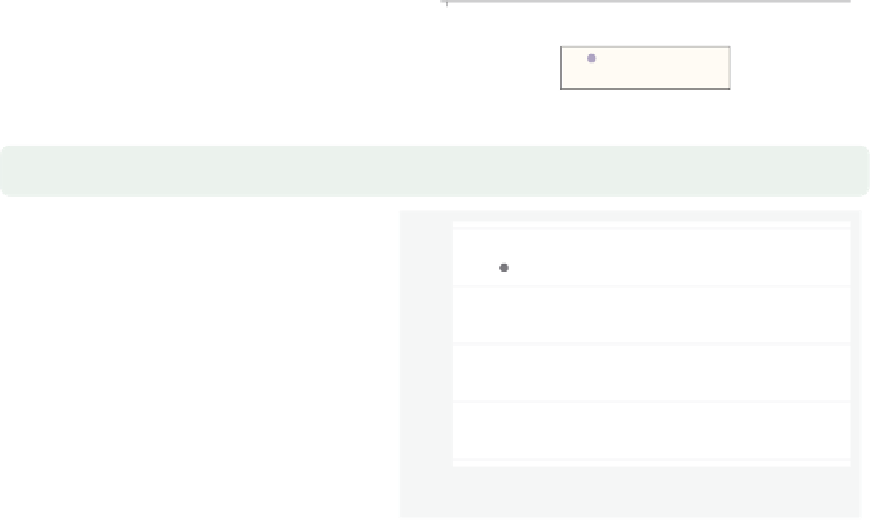
twoway scatter fv ownhome propval100, msymbol(i .)
connect(l i)
sort legend(label(1 Pred.
Perc.
Own) order(2 1)
cols(1)
)
The
cols(1)
option makes the items in
the legend display in a single column.
Uses allstates.dta & scheme vg past
0
20
40
60
80
100
% homes cost $100K+
% who own home
Pred. Perc. Own
twoway scatter ownhome propval100,
xtitle("Percent homes over $100K") ytitle("Percent who own home")
The
xtitle()
and
ytitle()
option
can be used to specify the titles for the
x
-axes. See
Options : Axis titles
(254) for more details about how to
control the display of axes. Note that
we are now using the
vg s2m
scheme,
one you might favor for graphs that will
be printed in black and white.
Uses allstates.dta & scheme vg s2m
-and
y
0
20
40
60
80
100
Percent homes over $100K
The electronic form of this topic is solely for direct use at UCLA and only by faculty, students, and staff of UCLA.