Graphics Reference
In-Depth Information
twoway scatter propval100 rent700 popden,
legend(cols(1) label(1 "Property Value")
label(2 "Rent")
)
Here, we add another
label()
option
for the
legend()
option, but in this
case, we change the label for the second
variable. Note that we can use the
label()
option repeatedly to change
the label for the different variables.
Uses allstates.dta & scheme vg s2c
0
2000
4000
6000
8000
10000
Pop/10 sq. miles
Property Value
Rent
Finally, let's consider an example that shows how to use the
twoway
command to over-
lay two plots, how each graph can have its own options, and how options can apply to the
overall graph.
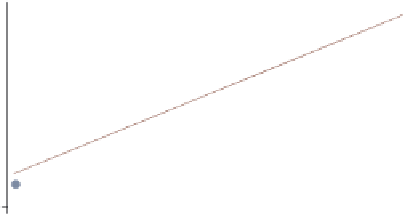
twoway (scatter propval100 popden)
(lfit propval100 popden)
Consider this graph, which shows a
scatterplot predicting property value
from population density and shows a
linear fit between these two variables.
Say that we wanted to change the
symbol displayed in the scatterplot and
the thickness of the line for the linear
fit.
Uses allstates.dta & scheme vg s2c
0
2000
4000
6000
8000
10000
Pop/10 sq. miles
% homes cost $100K+
Fitted values
The electronic form of this topic is solely for direct use at UCLA and only by faculty, students, and staff of UCLA.