Graphics Reference
In-Depth Information
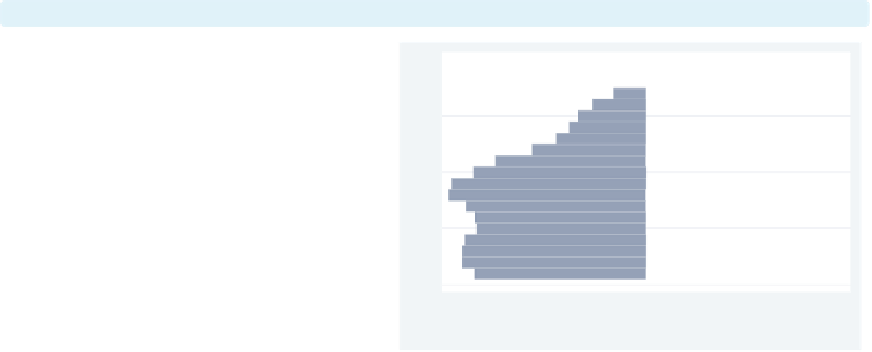
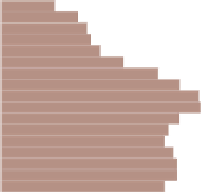
twoway (bar malmil agegrp,
horizontal
) (bar femmil agegrp,
horizontal
)
Adding the
horizontal
option to each
bar chart, we can see the graph taking
shape. However, we would like the age
categories to appear inside of the red
(female) bars.
Uses pop2000mf.dta & scheme s2color
−10
−5
0
5
10
malmil
femmil
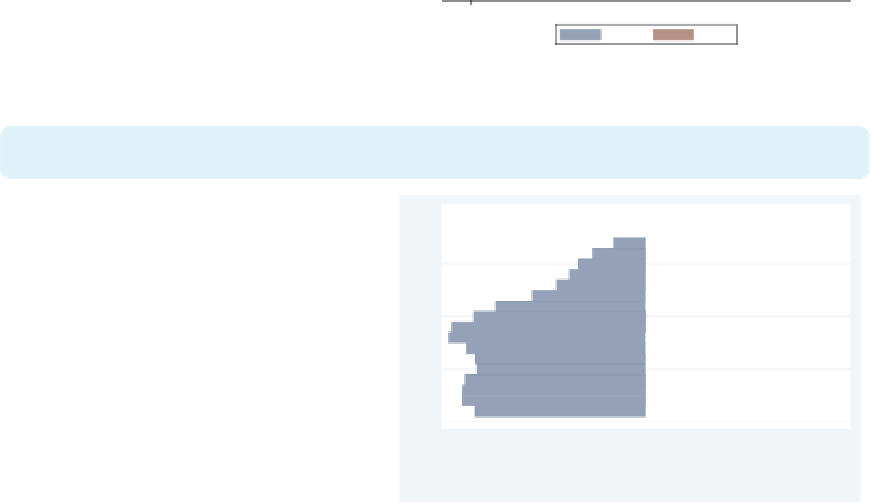
twoway (bar malmil agegrp, horizontal) (bar femmil agegrp, horizontal)
(scatter agegrp zero, msymbol(i) mlabel(agegrp) mlabcolor(black))
This
scatter
command uses
agegrp
(ranging from 1-17) as the
y
-value and
80 to 84
-value, leading to the
stack of 17 observations. Using the
msymbol(i)
and
mlabel()
options
suppresses the symbol but displays the
name of the age group from the labeled
value of
agegrp
. Next, we will fix the
label and title for the
zero
(0) for the
x
75 to 79
70 to 74
65 to 69
60 to 64
55 to 59
50 to 54
45 to 49
40 to 44
35 to 39
30 to 34
25 to 29
20 to 24
15 to 19
10 to 14
-axis.
Uses pop2000mf.dta & scheme s2color
x
5 to 9
Under 5
−10
−5
0
5
10
malmil
femmil
Age category
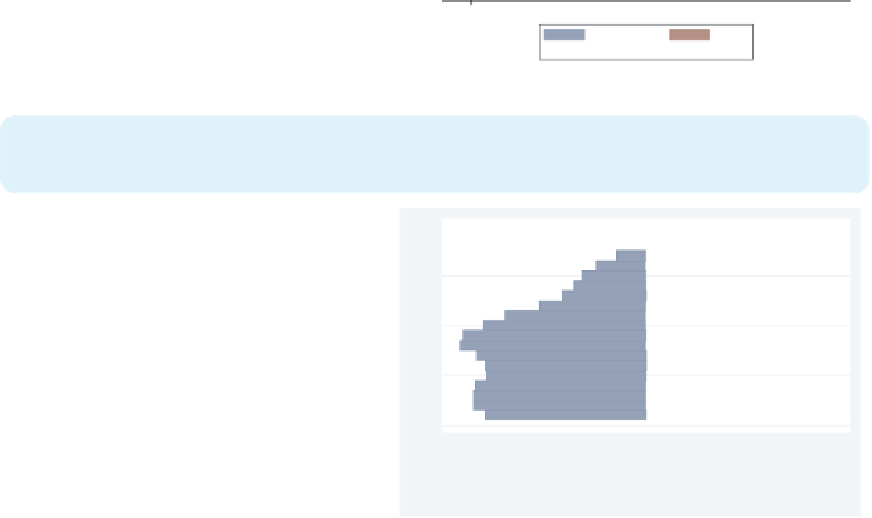
twoway (bar malmil agegrp, horizontal) (bar femmil agegrp, horizontal)
(scatter agegrp zero, msymbol(i) mlabel(agegrp) mlabcolor(black)),
xlabel(-12 "12" -8 "8" -4 "4" 4 8 12) xtitle("Population in millions")
We use the
xlabel()
to change
−
12 to
12,
4 to 4, and to label the
positive side of the
−
8to8,
−
80 to 84
-axis as 4, 8, and
12. We also add a title for the
x
75 to 79
70 to 74
x
-axis.
65 to 69
60 to 64
55 to 59
Next, let's fix the
y
-axis and the legend.
50 to 54
45 to 49
40 to 44
35 to 39
30 to 34
Uses pop2000mf.dta & scheme s2color
25 to 29
20 to 24
15 to 19
10 to 14
5 to 9
Under 5
12
8
4
4
8
12
Population in millions
malmil
femmil
Age category
The electronic form of this topic is solely for direct use at UCLA and only by faculty, students, and staff of UCLA.