Graphics Reference
In-Depth Information
graph combine hilo vol,
cols(1)
Using the
cols(1)
option, we can
display the price above the volume.
However, because the
-axes of these
two graphs are scaled the same, we
could save space and remove the
x
x
-axis
1Jan01
1Apr01
1Jul01
1Oct01
1Jan02
scale from the top graph.
Uses sp2001ts.dta & scheme vg s2c
Date
1Jan01
1Apr01
1Jul01
1Oct01
1Jan02
Date
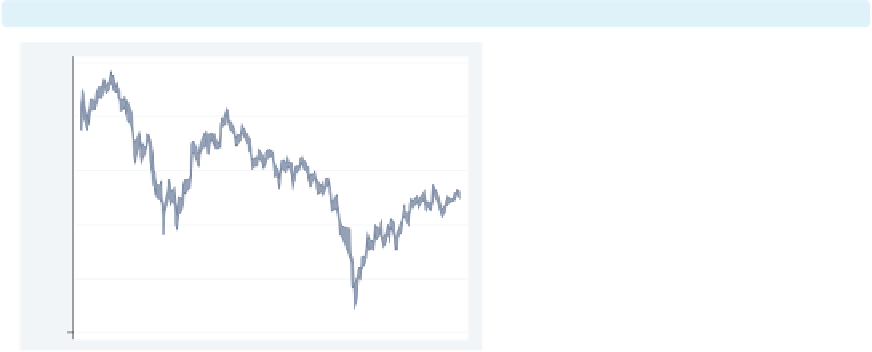
twoway rarea high low date,
xscale(off)
name(hilo,
replace
)
Here, we use the
xscale(off)
option
to suppress the display of the
-axis,
including the space that would be
allocated for the labels. We name this
graph
hilo
again but need to use the
replace
option to replace the existing
graph named
hilo
.
Uses sp2001ts.dta & scheme vg s2c
x
graph combine hilo vol, cols(1)
We combine these two graphs; however,
we might want to push the graphs a bit
closer together.
Uses sp2001ts.dta & scheme vg s2c
1Jan01
1Apr01
1Jul01
1Oct01
1Jan02
Date
The electronic form of this topic is solely for direct use at UCLA and only by faculty, students, and staff of UCLA.