Graphics Reference
In-Depth Information
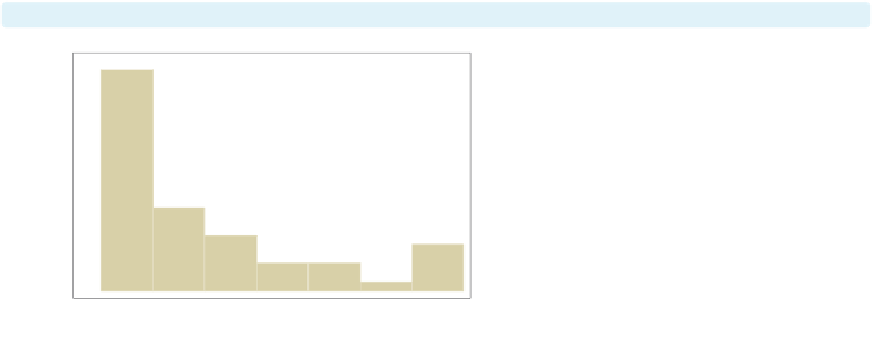
graph display
hist2
The
graph display
command is
similar to the
graph use
command,
except that it redisplays graphs saved
in memory. Here, we redisplay the
graph we created with the
name(hist2)
option.
Uses allstates.dta & scheme vg s1c
0
20
40
60
80
% homes cost $100K+
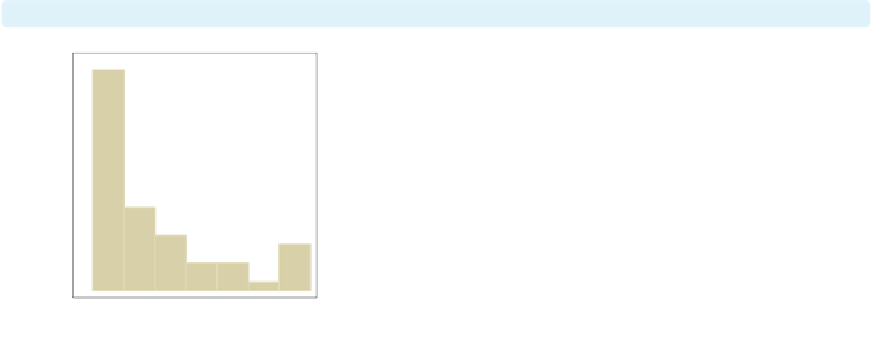
graph display hist2,
xsize(2) ysize(2)
The
graph display
command allows us to use the
xsize()
and
ysize()
options to change the size and
aspect ratio of the graph. Here, we redisplay the graph
we named
hist2
and make the graph 2 inches tall by 2
inches wide.
Uses allstates.dta & scheme vg s1c
0
20
40
60
80
% homes cost $100K+
graph display hist2,
scheme(s1mono)
We can also use the
scheme()
option to view the same
graph using a different scheme. Here, we view the
previous graph but use the
s1mono
scheme.
Uses allstates.dta & scheme s1mono
0
20
40
60
80
% homes cost $100K+
The electronic form of this topic is solely for direct use at UCLA and only by faculty, students, and staff of UCLA.