Graphics Reference
In-Depth Information
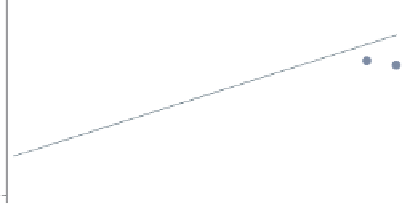
avplot popden, title("Added variable plot")
We return to the regression analysis
predicting
propval100
from two
variables,
popden
and
pcturban
. Here,
we show an added-variable plot with
the
title()
option to add a title. We
could also add a
subtitle()
,
caption()
,or
note()
to the graph, as
well; see
Standard options : Titles
(313)
for more details.
Uses allstates.dta & scheme vg s2c
Before running the graph command,
type
reg propval100 popden pcturban
Added variable plot
−2000
0
2000
4000
6000
e( popden | X )
coef = .00673009, se = .00120878, t = 5.57
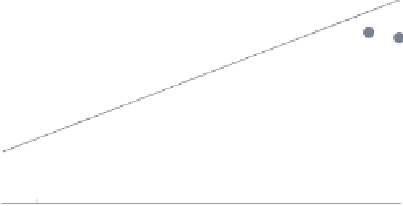
avplot popden,
note("")
Here, we add the
note("")
option,
which suppresses the display of the note
at the bottom showing the coecients
for the regression model.
Uses allstates.dta & scheme vg s2c
Before running the graph command,
type
reg propval100 popden pcturban
−2000
0
2000
4000
6000
e( popden | X )
avplot popden,
scheme(economist)
We can change the look of the graph by
selecting a different scheme. Here, we
use
scheme(economist)
to display the
graph using the
economist
scheme. See
Standard options : Schemes
(318) for
more details.
Uses allstates.dta & scheme vg s2c
Before running the graph command,
type
reg propval100 popden pcturban
coef = .00673009, se = .00120878, t = 5.57
60
40
20
0
−20
−40
−2000
0
2000
4000
6000
e( popden | X )
The electronic form of this topic is solely for direct use at UCLA and only by faculty, students, and staff of UCLA.