Graphics Reference
In-Depth Information
avplot popden
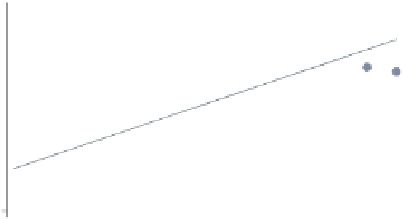
Consider this added-variable plot. We
can modify the axis titles as illustrated
in the following examples.
Uses allstates.dta & scheme vg s2c
Before running the graph command,
type
reg propval100 popden pcturban
−2000
0
2000
4000
6000
e( popden | X )
coef = .00673009, se = .00120878, t = 5.57
avplot popden,
xtitle("popden adjusted for percent urban")
ytitle("property value adjusted for percent urban")
Here, we use the
xtitle()
and
ytitle()
options to change the titles of
the
-axes. See
Options : Axis titles
(254) for more
details.
Uses allstates.dta & scheme vg s2c
Before running the graph command,
type
reg propval100 popden pcturban
x
-and
y
−2000
0
2000
4000
6000
popden adjusted for percent urban
coef = .00673009, se = .00120878, t = 5.57
avplot popden, note("Regression statistics for popden",
prefix
)
The
prefix
option can be used with
the different title options to add a prefix
to an existing title. In the
note()
option, for example, we add text before
the existing note. In this way, we add
additional descriptive information to an
existing title, subtitle, note, or caption.
We could also use the
suffix
option to
add information after an existing title.
Uses allstates.dta & scheme vg s2c
Before running the graph command,
type
reg propval100 popden pcturban
−2000
0
2000
4000
6000
e( popden | X )
Regression statistics for popden
coef = .00673009, se = .00120878, t = 5.57
The electronic form of this topic is solely for direct use at UCLA and only by faculty, students, and staff of UCLA.


