Graphics Reference
In-Depth Information
11.2
Common options for statistical graphs, stat graph op-
tions
This section illustrates how to use Stata graph options with specialized statistical graph
commands. Many of the examples will assume that we have run the command
. regress propval100 popden pcturban
and will illustrate subsequent commands with options to customize those specialized statis-
tics graphs.
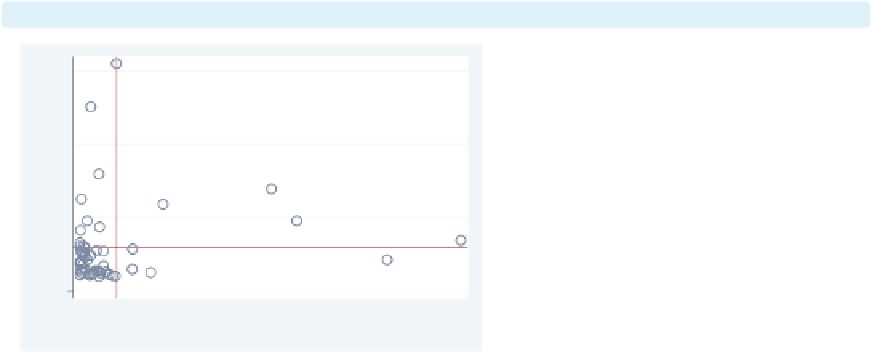
lvr2plot
Consider this regression analysis, which
predicts
propval100
from two
variables,
popden
and
pcturban
.We
can use the
lvr2plot
command to
produce a leverage-versus-residual
squared plot.
Uses allstates.dta & scheme vg s2c
Before running the graph command,
type
reg propval100 popden pcturban
0
.05
.1
.15
.2
Normalized residual squared
lvr2plot,
msymbol(Oh) msize(vlarge)
We can add options such as
msymbol()
and
msize()
to control the display of
the markers in the graph. See
Options : Markers
(235) for more details.
Uses allstates.dta & scheme vg s2c
Before running the graph command,
type
reg propval100 popden pcturban
0
.05
.1
.15
.2
Normalized residual squared
The electronic form of this topic is solely for direct use at UCLA and only by faculty, students, and staff of UCLA.