Graphics Reference
In-Depth Information
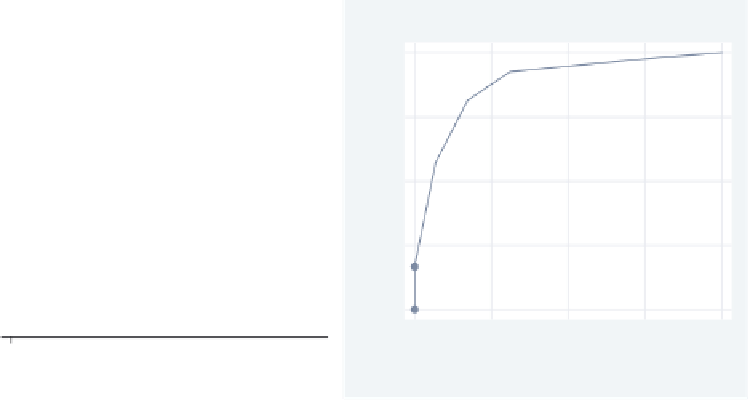
roctab, graph
rocplot
0.00
0.25
0.50
0.75
1.00
0
.25
.5
.75
1
1 − Specificity
Area under ROC curve = 0.8828
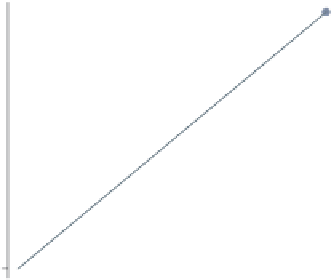
1 − Specificity
Area under curve = 0.8945 se(area) = 0.0305
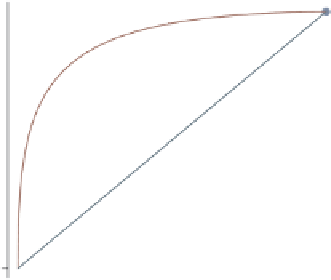
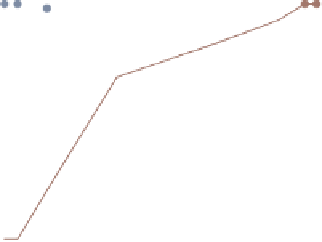
roccomp, graph
lroc
0.00
0.25
0.50
0.75
1.00
0.00
0.25
0.50
0.75
1.00
1 − Specificity
Area under ROC curve = 0.8828
1−Specificity
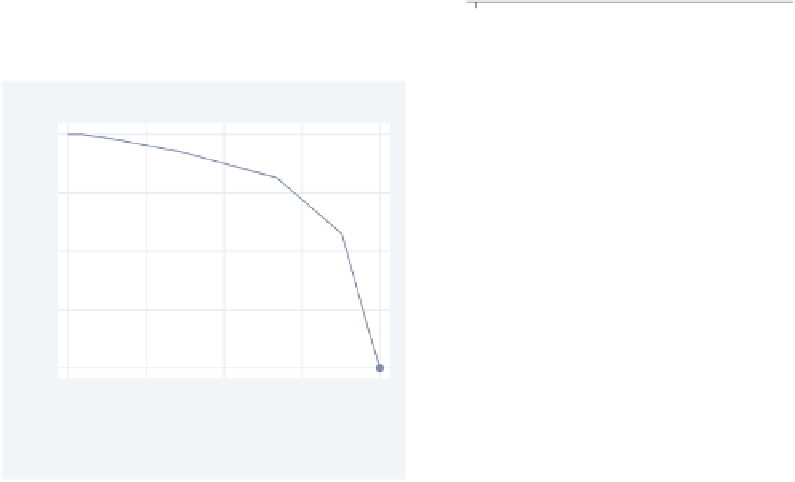
lsens
0.00
0.25
0.50
0.75
1.00
Probability cutoff
Sensitivity
Specificity
The electronic form of this topic is solely for direct use at UCLA and only by faculty, students, and staff of UCLA.