Graphics Reference
In-Depth Information
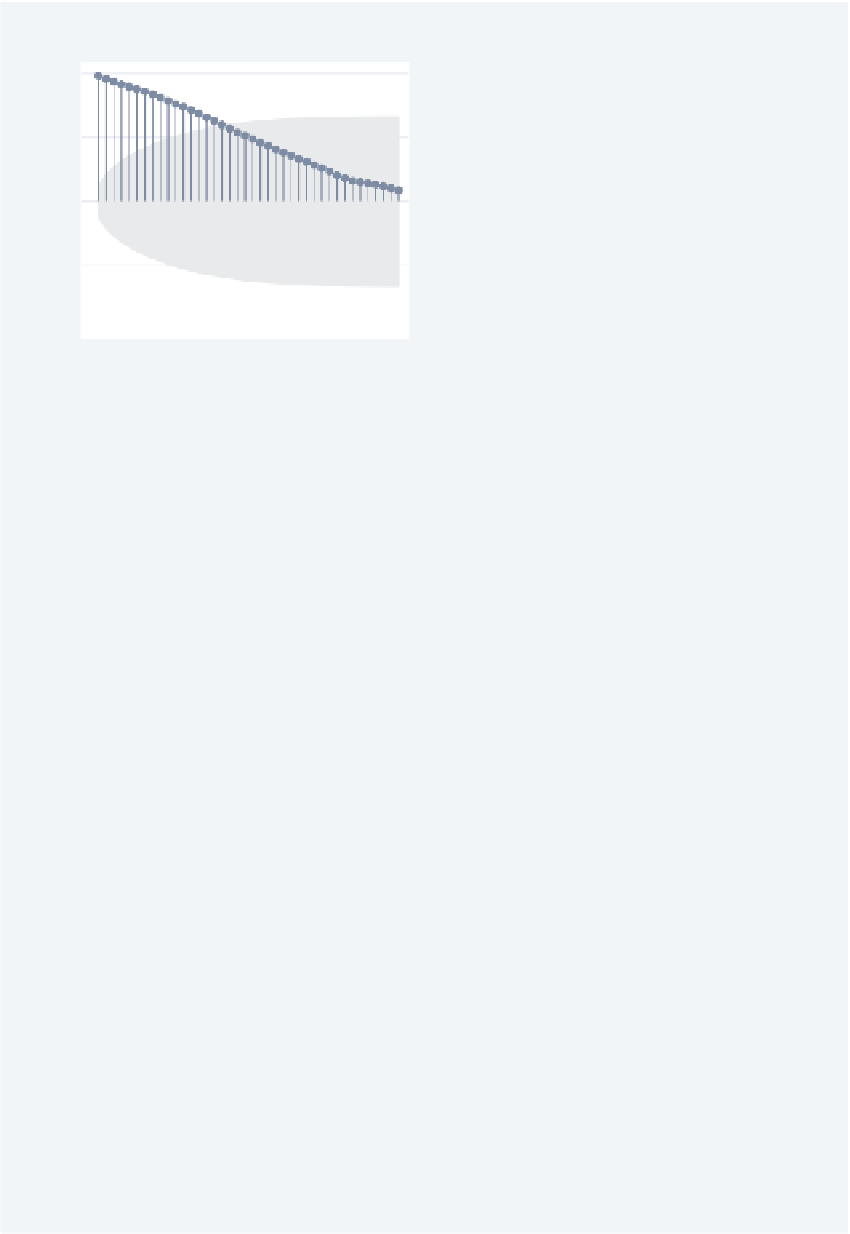
ac
pac
0
10
20
30
40
0
10
20
30
40
Lag
Lag
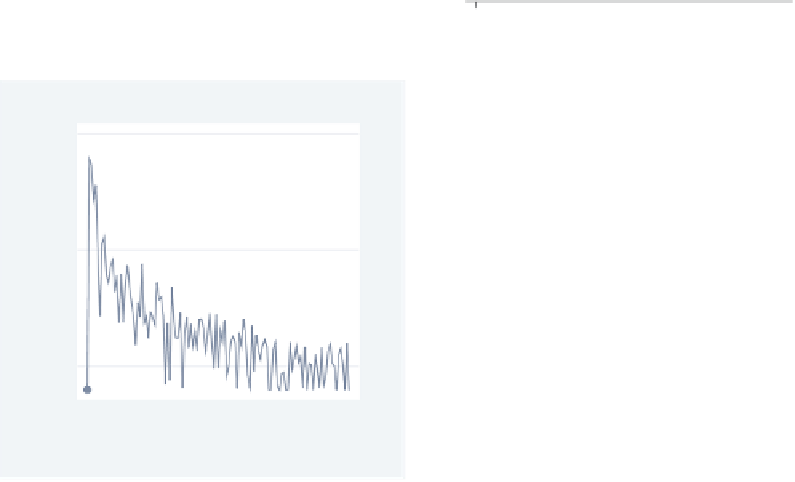
pergram
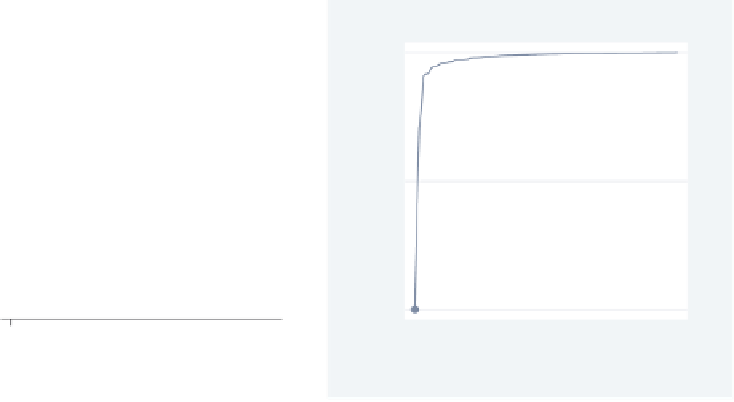
cumsp
0.00
0.10
0.20
0.30
0.40
0.50
0.00
0.10
0.20
0.30
0.40
0.50
Frequency
Frequency
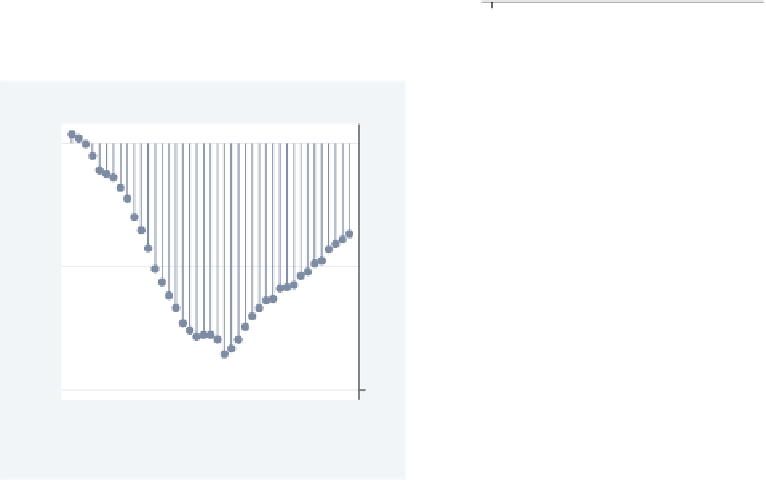
xcorr
wntestb
−20
−10
0
10
20
0.00
0.10
0.20
0.30
0.40
0.50
Lag
Frequency
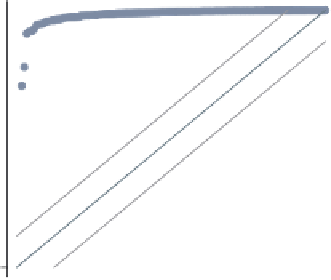
Figure 11.5: Time-series graphs
The electronic form of this topic is solely for direct use at UCLA and only by faculty, students, and staff of UCLA.