Graphics Reference
In-Depth Information
histogram
spikeplot
0
10
20
30
40
0
10
20
30
40
hourly wage
hourly wage
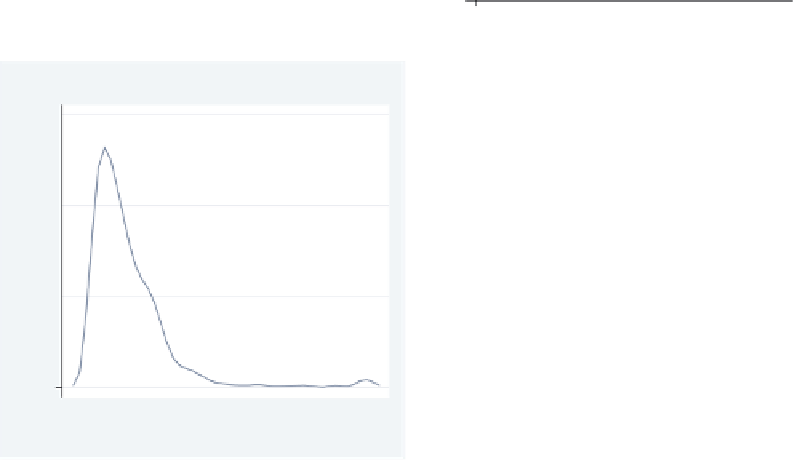
kdensity
symplot
0
10
20
30
40
0
1
2
3
4
5
hourly wage
Distance below median
pnorm
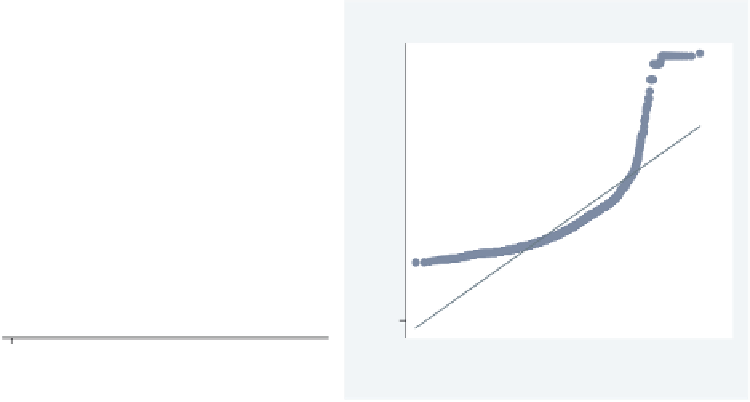
qnorm
0.00
0.25
0.50
0.75
1.00
−10
0
10
20
30
Empirical P[i] = i/(N+1)
Inverse Normal
Figure 11.1: Distribution graphs
The electronic form of this topic is solely for direct use at UCLA and only by faculty, students, and staff of UCLA.