Graphics Reference
In-Depth Information
scatter close tradeday
Here, we make a scatterplot showing
the closing price on the
y
-axis and the
trading day (numbered 1 to 40) on the
x
-axis. Normally, we would connect
these points.
Uses spjanfeb2001.dta & scheme vg s2c
0
10
20
30
40
Trading day number
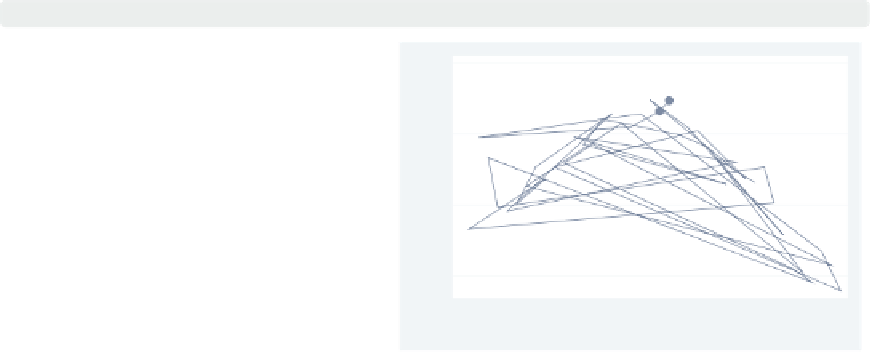
scatter close tradeday,
connect(l)
Here, we add the
connect(l)
option,
but this is probably not the kind of
graph we wanted to create. The
problem is that the observations are in
a random order, but the observations
are connected in the same order as they
appear in the data. We really want the
points to be connected based on the
order of
tradeday
.
Uses spjanfeb2001.dta & scheme vg s2c
0
10
20
30
40
Trading day number
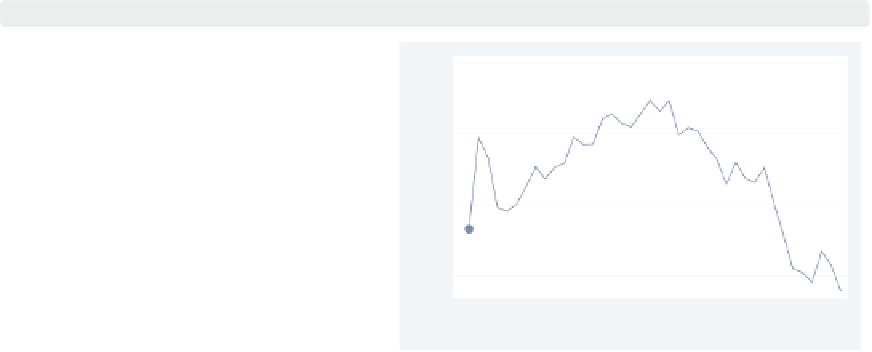
scatter close tradeday, connect(l)
sort
To fix the previous graph, we can either
first use the
sort
command to sort the
data on
tradeday
or, as we do here, use
the
sort
option to tell Stata to sort the
data on
tradeday
before connecting the
points. We also could have specified
sort(tradeday)
, and it would have
had the same effect.
Uses spjanfeb2001.dta & scheme vg s2c
0
10
20
30
40
Trading day number
The electronic form of this topic is solely for direct use at UCLA and only by faculty, students, and staff of UCLA.