Graphics Reference
In-Depth Information
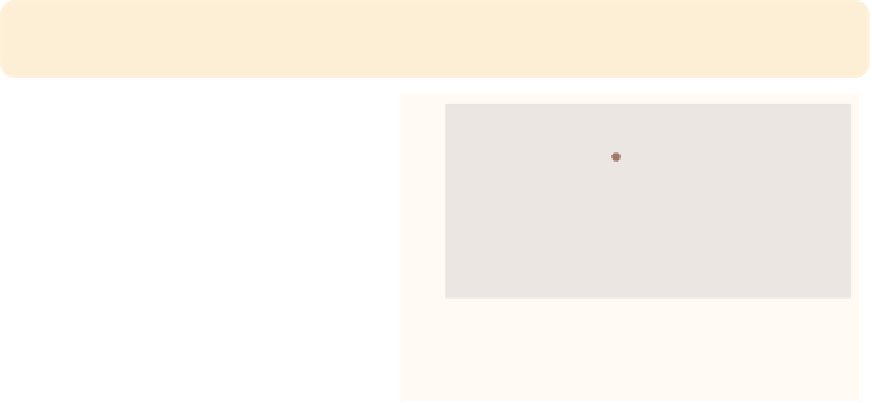
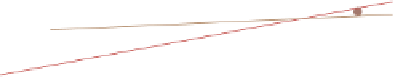
twoway (scatter ownhome borninstate) (lfit ownhome borninstate)
(lfit ownhome borninstate if stateab !="DC",
text(45 70 "Coef with DC .16" "Coef without DC .44", box
linegap(4)
))
We can change the gap between the
lines with the
linegap()
option. Here,
we make the gap larger than it
normally would be. See
Styles : Margins
(338) for more details.
Uses allstatesn.dta & scheme vg rose
80
70
60
50
Coef with DC .16
Coef without DC .44
40
40
50
60
70
80
% born in state of residence
% who own home
Fitted values
Fitted values
Let's now consider options that control the color of the textbox and the characteristics
of the outline of the box (including the color, thickness, and pattern). This next set of
graphs uses the
vg past
scheme.
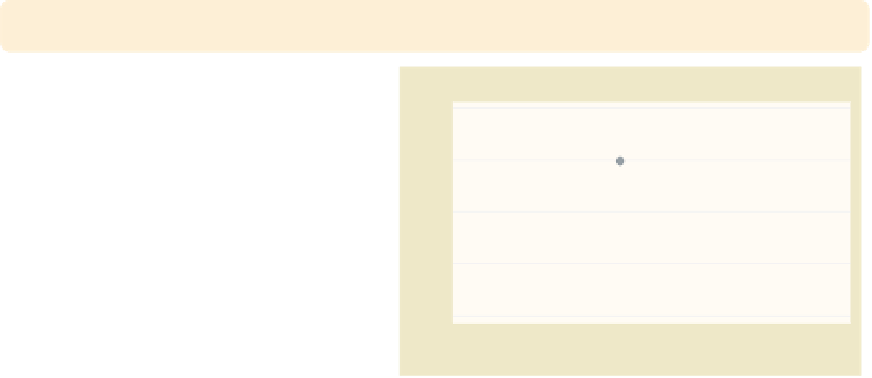
twoway (scatter ownhome borninstate),
title("% own home by % reside in state")
Consider this graph with a title at the
top.
Uses allstatesn.dta & scheme vg past
% own home by % reside in state
40
50
60
70
80
% born in state of residence
The electronic form of this topic is solely for direct use at UCLA and only by faculty, students, and staff of UCLA.