Graphics Reference
In-Depth Information
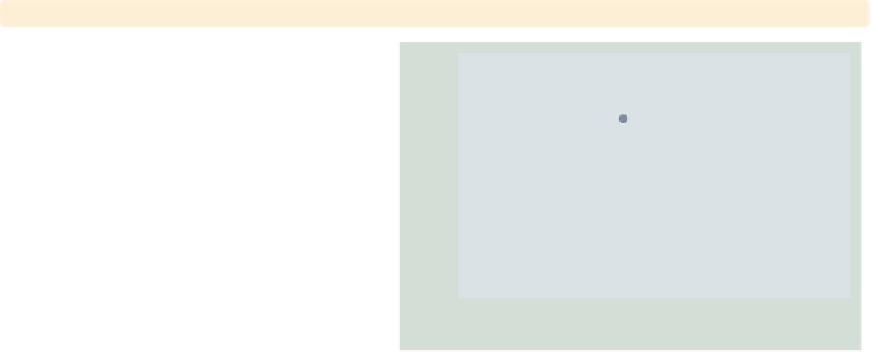
twoway scatter ownhome borninstate,
text(43 40 "DC")
Instead, we can use the
text()
option
to add text to our graph. Looking at
the values of
ownhome
and
borninstate
for
DC
, we see that their values are
about 43 and 40, respectively. We use
these as coordinates to label the point,
but the
text()
option places the label
at the center of the specified
80
70
60
yx
coordinate, sitting right over the point.
Uses allstatesn.dta & scheme vg teal
50
DC
40
40
50
60
70
80
% born in state of residence
twoway scatter ownhome borninstate, text(43 40 "DC",
placement(ne)
)
Adding the
placement(ne)
option
places the label above and to the right
(northeast) of the point. Other options
you could choose include
n
,
ne
,
e
,
se
,
s
,
sw
,
w
,
nw
,and
c
(center); see
Styles : Compassdir
(331) for more
details.
Uses allstatesn.dta & scheme vg teal
80
70
60
50
DC
40
40
50
60
70
80
% born in state of residence
twoway (scatter ownhome borninstate, text(43 40 "DC", placement(e)))
(lfit ownhome borninstate) (lfit ownhome borninstate if stateab !="DC")
Consider this scatterplot showing a
linear fit between the two variables: one
including Washington,
DC
, and one
omitting Washington,
DC
. See the next
graph, which uses the
text()
option to
label the graph instead of the legend.
Uses allstatesn.dta & scheme vg teal
80
70
60
50
DC
40
40
50
60
70
80
% born in state of residence
% who own home
Fitted values
Fitted values
The electronic form of this topic is solely for direct use at UCLA and only by faculty, students, and staff of UCLA.