Graphics Reference
In-Depth Information
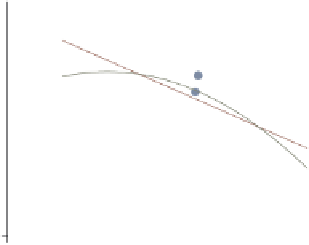
twoway (scatter ownhome urban) (lfit ownhome urban) (qfit ownhome urban),
legend(order(2 "Linear" "Fit" 3 "Quadratic" "Fit")
stack
cols(1))
Using the
stack
option, we can stack
the symbols above the labels. We use
this here to make a tall, narrow legend.
Uses allstatesdc.dta & scheme vg s2c
20
40
60
80
100
Percent urban 1990
Linear
Fit
Quadratic
Fit
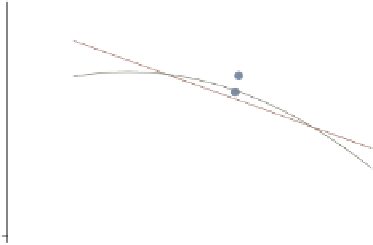
twoway (scatter ownhome urban) (lfit ownhome urban) (qfit ownhome urban),
legend(order(2 "Linear" "Fit" 3 "Quadratic" "Fit")
stack cols(1)
position(3)
)
We can use the
position()
option to
change where the legend is displayed.
Here, we take the narrow legend from
the previous graph and put it to the
right of the graph, making good use of
space.
Uses allstatesdc.dta & scheme vg s2c
Linear
Fit
Quadratic
Fit
20
40
60
80
100
Percent urban 1990
twoway (scatter ownhome urban) (lfit ownhome urban) (qfit ownhome urban),
legend(order(2 "Linear" "Fit" 3 "Quadratic" "Fit")
stack cols(1)
ring(0) position(7)
)
We can use the
ring(0)
option to place
the legend inside the plot area and use
position(7)
to put it in the bottom
left corner, using the empty space in
the plot for the legend.
Uses allstatesdc.dta & scheme vg s2c
Linear
Fit
Quadratic
Fit
20
40
60
80
100
Percent urban 1990
The electronic form of this topic is solely for direct use at UCLA and only by faculty, students, and staff of UCLA.