Graphics Reference
In-Depth Information
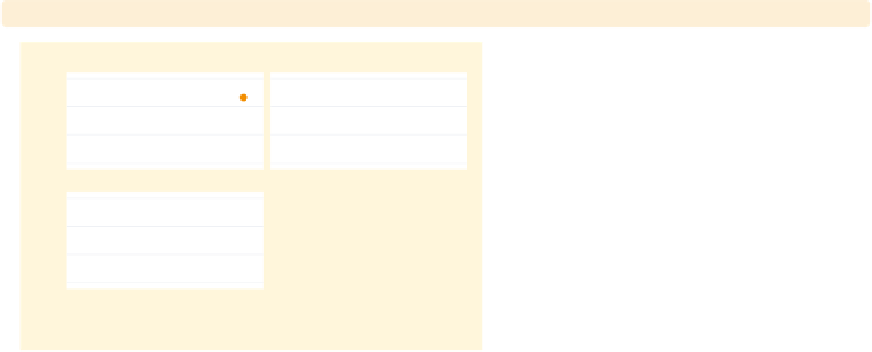
twoway scatter ownhome borninstate, by(north, total
noedgelabel
)
The
noedgelabel
option suppresses the
displayofthe
S & W
North
-axis for the graphs that
do not appear on the bottom row, in
this case the graph for the North.
Uses allstatesdc.dta & scheme vg brite
x
Total
20
40
60
80
% born in state of residence
Graphs by Region North or Not
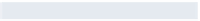
twoway scatter ownhome borninstate, by(north,
yrescale
)
The
yrescale
option allows the
y
S & W
North
-variables to be scaled independently
for each by-group.
Uses allstatesdc.dta & scheme vg brite
20
40
60
80
20
40
60
80
% born in state of residence
Graphs by Region North or Not
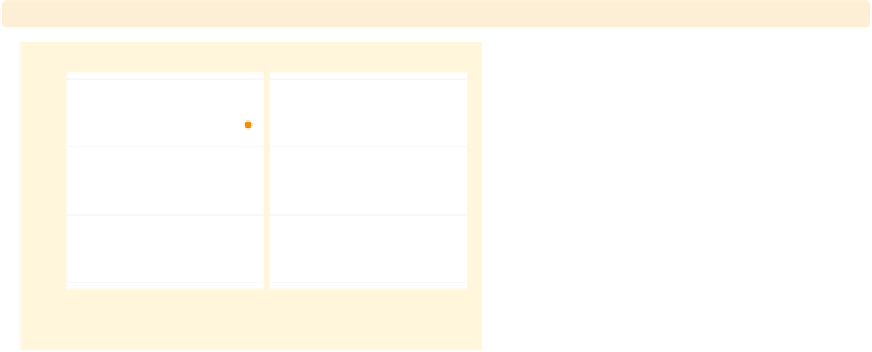
twoway scatter ownhome borninstate, by(north,
xrescale
)
Likewise, the
xrescale
option allows
the
S & W
North
x
-variable to be scaled differently
across all the by-groups.
Uses allstatesdc.dta & scheme vg brite
20
40
60
80
40
50
60
70
80
% born in state of residence
Graphs by Region North or Not
The electronic form of this topic is solely for direct use at UCLA and only by faculty, students, and staff of UCLA.