Graphics Reference
In-Depth Information
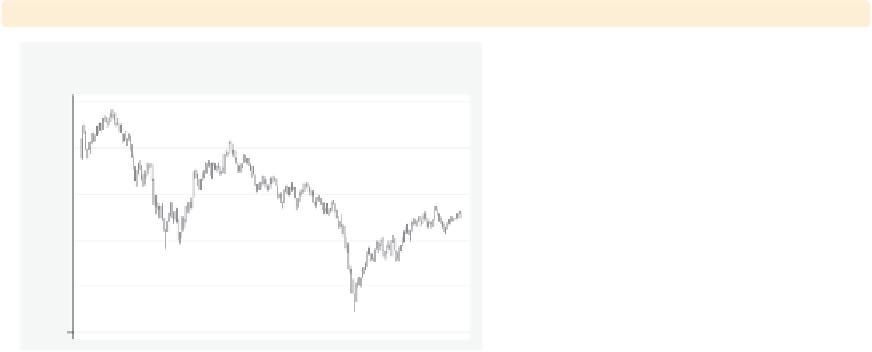
twoway rspike high low tradeday,
xscale(off)
If we wish, we could remove the display
of the
-axis entirely with the
xscale(off)
option. Although it is not
shown, the same could be done for the
y
x
-axis if we were to use the
yscale(off)
option. This is not
normally an option we would use, but it
can be useful for combining multiple
graphs on the same scale without
having to show the scale on some of the
graphs.
Uses sp2001.dta & scheme vg s2m
twoway rspike high low tradeday,
xscale(alt)
x
We could shift the display of the
-axis
from the bottom of the graph to the
top of the graph with the
xscale(alt)
option. Likewise, we could have chosen
to supply the
yscale(alt)
option to
shift the
Trading day number
0
50
100
150
200
250
y
-axis from the left to the
right.
Uses sp2001.dta & scheme vg s2m
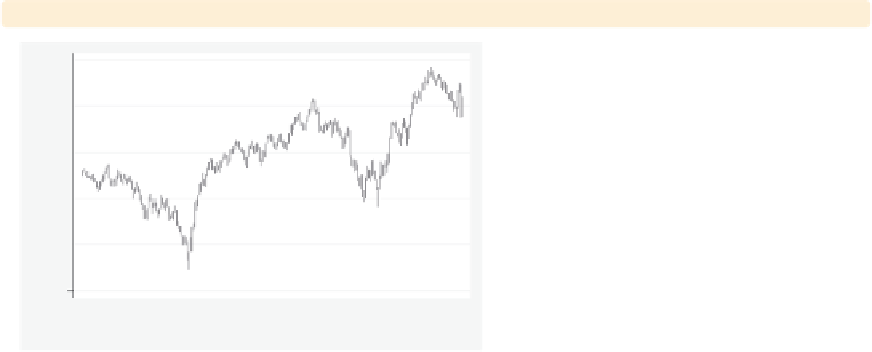
twoway rspike high low tradeday,
xscale(reverse)
x
We can reverse the scale of the
-axis
by specifying the
xscale(reverse)
option, as illustrated here. We can
reverse the
-axis by indicating the
yscale(reverse)
option.
Uses sp2001.dta & scheme vg s2m
y
250
200
150
100
50
0
Trading day number
The electronic form of this topic is solely for direct use at UCLA and only by faculty, students, and staff of UCLA.