Graphics Reference
In-Depth Information
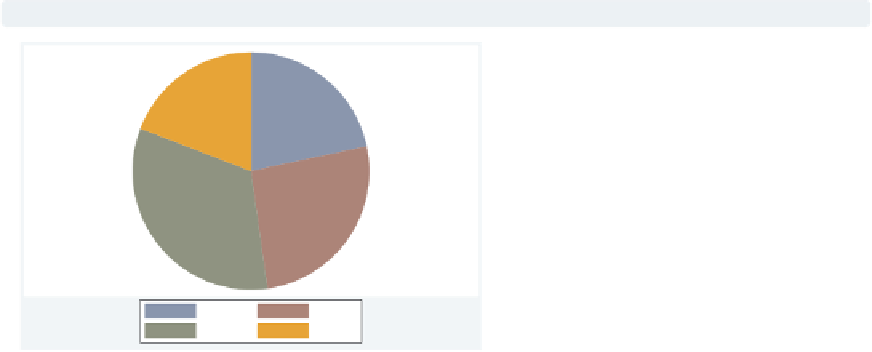
graph pie
popk, over(region)
The
graph pie
command can be used
to show pie charts. See
Pie
(217) for
more details.
Uses allstates.dta & scheme vg s2c
NE
N Cntrl
South
West
1.3
Schemes
While the previous section was about the different types of graphs Stata can make, this
section is about the different kinds of looks that you can have for Stata graphs. The basic
starting point for the look of a graph is a scheme, which controls just about every aspect
of the look of the graph. A scheme sets the stage for the graph, but you can use options
to override the settings in a scheme. As you might surmise, if you choose (or develop) a
scheme that produces graphs similar to the final graph you wish to make, you can reduce
the need to customize your graphs using options. Here, we give you a basic flavor of what
schemes can do and introduce you to the schemes you will be seeing throughout the topic.
See
Intro : Using this topic
(1) for more details about how to select and use schemes and
Appendix : Online supplements
(382) for more information about how to download them.
The electronic form of this topic is solely for direct use at UCLA and only by faculty, students, and staff of UCLA.