Graphics Reference
In-Depth Information
twoway scatter close tradeday,
connect(J)
sort
You would not normally connect
observations for this kind of graph
using a stairstep pattern. This
connection method, obtained by using
the
connect(J)
option, would more
normally be used in a graph showing a
survival function over time.
Uses spjanfeb2001.dta & scheme
vg blue
1400
1350
1300
1250
0
10
20
30
40
Trading day number
twoway scatter close tradeday,
connect(stepstair)
sort
A connection method related to the one
above can be obtained using the
connect(stepstair)
option.
Uses spjanfeb2001.dta & scheme
vg blue
1400
1350
1300
1250
0
10
20
30
40
Trading day number
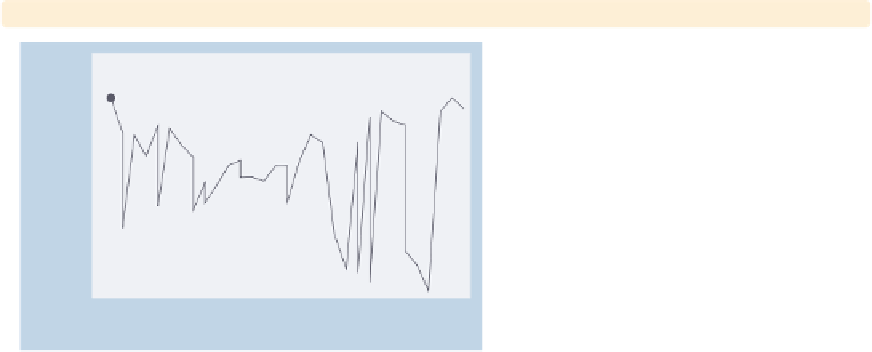
twoway scatter close dom, connect(l) sort
Say that we wanted to show the closing
price as a function of the day of the
month for the two months for which we
have data. In this example, we have the
variable
dom
(day of the month) on the
x
1400
1350
-axis. If we include the
sort
option,
the data are shown as one continuous
line, as opposed to having one line for
January and a second line for February.
Uses spjanfeb2001.dta & scheme
vg blue
1300
1250
0
10
20
30
Day of month
The electronic form of this topic is solely for direct use at UCLA and only by faculty, students, and staff of UCLA.