Graphics Reference
In-Depth Information
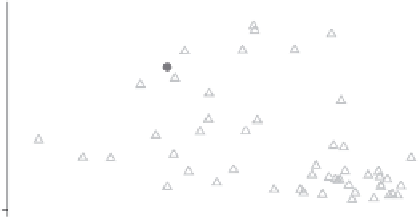
twoway scatter ownhome propval100 borninstate,
mstyle(p1 p10)
In this graph, we use the
mstyle(p1
p10)
option to request that the first
variable be plotted with the
p1
style
and the second be plotted with the
p10
style. A style is just a starting point,
and we can use additional options to
modify the markers to suit our taste.
Uses allstates.dta & scheme vg s2m
20
40
60
80
% born in state of residence
% who own home
% homes cost $100K+
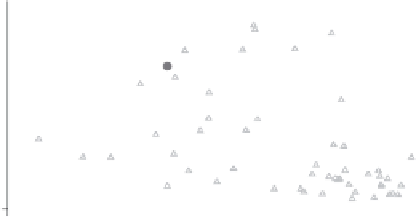
twoway scatter ownhome propval100 borninstate, mstyle(p1 p10)
msize(.
medium)
Say that in the previous graph you
wanted medium-sized triangles. We can
add the
msize(. medium)
option to
control the size of the second marker,
leaving the first unchanged. So, even
though a style chooses a number of
characteristics for the markers, we can
override them.
Uses allstates.dta & scheme vg s2m
20
40
60
80
% born in state of residence
% who own home
% homes cost $100K+
twoway scatter ownhome propval100 borninstate, mstyle(p1 p1)
mfcolor(.
white)
In this example, we use the
p1
style for
both the first and second markers,
which are small, dark gray, filled circles.
If no other options are specified, the
markers for the first variable will be
identical to those for the second. But
adding the
mfcolor(. white)
option,
the fill color for the first variable was
left alone, and the second was changed
to white. This easily gave us solid and
white-filled circles for the two markers.
Uses allstates.dta & scheme vg s2m
20
40
60
80
% born in state of residence
% who own home
% homes cost $100K+
The electronic form of this topic is solely for direct use at UCLA and only by faculty, students, and staff of UCLA.