Graphics Reference
In-Depth Information
twoway scatter ownhome propval100 borninstate
Aside from aesthetics, choosing
different marker symbols is useful to
differentiate multiple markers displayed
in the same plot. In this example, we
plot two
-variables, and Stata displays
both as solid circles, differing in color.
Uses allstates.dta & scheme vg s2c
y
20
40
60
80
% born in state of residence
% who own home
% homes cost $100K+
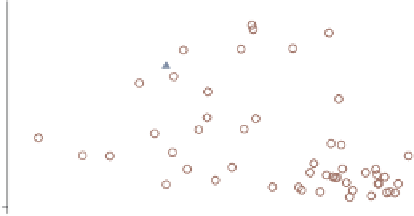
twoway scatter ownhome propval100 borninstate,
msymbol(t Oh)
To further differentiate the symbols, we
add the
msymbol(t Oh)
option to
control both markers. Here, we make
the first marker a small triangle and the
second a larger hollow circle.
Uses allstates.dta & scheme vg s2c
20
40
60
80
% born in state of residence
% who own home
% homes cost $100K+
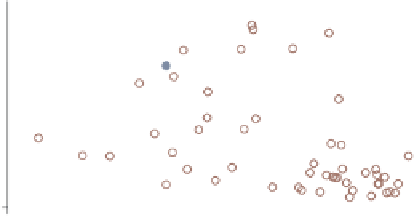
twoway scatter ownhome propval100 borninstate,
msymbol(.
Oh)
Using the
msymbol(. Oh)
option, we
can leave the first symbol unchanged
(as indicated by the dot) and change
the second symbol to a hollow circle.
We might think that the dot indicates a
small point, but that is indicated by the
p
option.
Uses allstates.dta & scheme vg s2c
20
40
60
80
% born in state of residence
% who own home
% homes cost $100K+
The electronic form of this topic is solely for direct use at UCLA and only by faculty, students, and staff of UCLA.