Graphics Reference
In-Depth Information
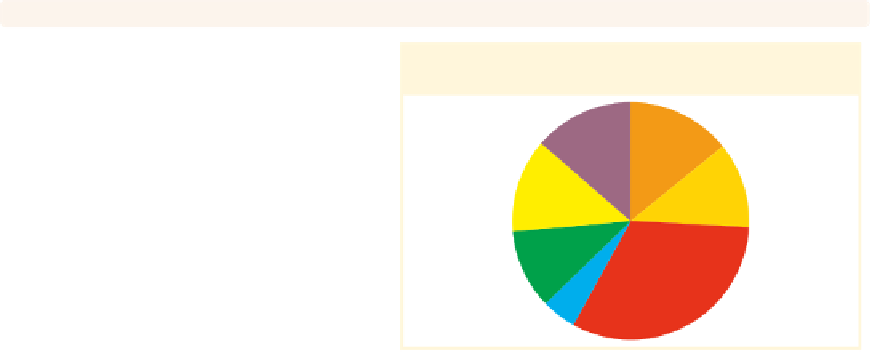
graph pie, over(occ7)
legend(position(12) rows(2))
We can use the
position()
option to
control the position of the legend,
indicating its position like the numbers
on a clock face; see
Styles : Clockpos
(330). Here, we put the legend at the
12 o'clock position, placing it at the top
of the chart, and also add the
rows(2)
option to make the legend display in
two rows.
Uses nlsw.dta & scheme vg brite
Prof
Mgmt
Sales
Cler.
Operat.
Labor
Other
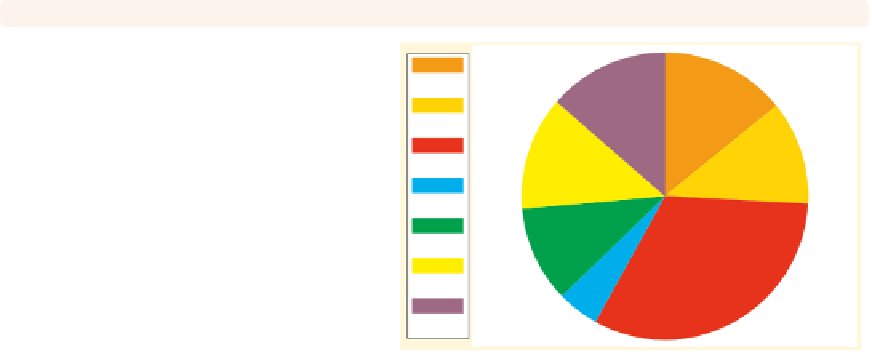
graph pie, over(occ7)
legend(position(9) cols(1) stack
)
Here, we use the same options as those
in the last example but use them to
place the legend to the left of the graph
(in the 9 o'clock position) and make the
legend display in a single column. We
also add the
stack
option to the
previous example to stack the symbol
and descriptive text above each other.
This makes an even narrower column,
leaving more room for the pie chart.
Uses nlsw.dta & scheme vg brite
Prof
Mgmt
Sales
Cler.
Operat.
Labor
Other
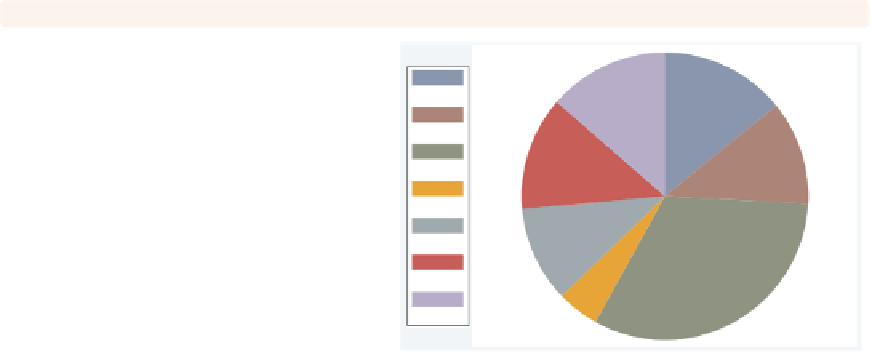
graph pie, over(occ7)
Here, we use the
vg lgndc
scheme.
Using this scheme places the legend to
the left in a single column with the
symbol stacked above the description.
Uses nlsw.dta & scheme vg lgndc
Prof
Mgmt
Sales
Cler.
Operat.
Labor
Other
The electronic form of this topic is solely for direct use at UCLA and only by faculty, students, and staff of UCLA.


