Graphics Reference
In-Depth Information
7.4
Slice labels
This section describes how you can label the pie slices. For more details, see [
G
]
graph
pie
. For this section, we will use the
economist
scheme.
graph pie, over(occ7)
plabel( all sum)
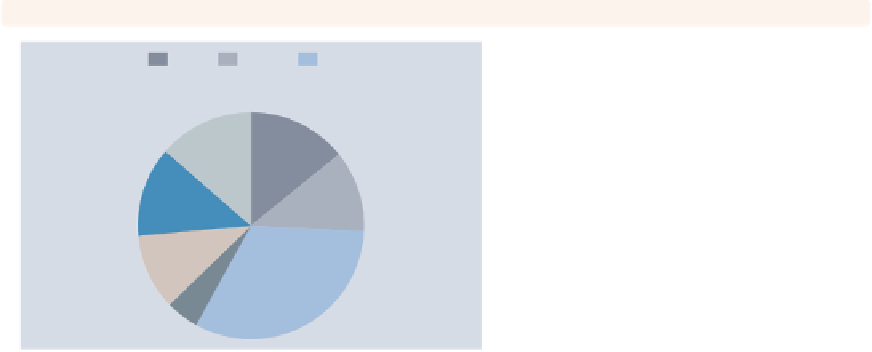
Consider this pie chart showing the
number of women who work in these
seven different occupations. Here, we
use the
plabel()
(pie label) option to
label all slices with the sum, in this
case the frequency of women who work
in each occupation. Notice how
readable the labels are because of the
pale colors of the pie slices selected by
the
vg past
scheme. Other schemes
with more intense colors would have
made these labels hard to read.
Uses nlsw.dta & scheme economist
Prof
Mgmt
Sales
Cler.
Operat.
Labor
Other
305
317
286
264
246
102
726
graph pie, over(occ7) plabel( all
percent
)
Using the
percent
option, we can show
the percent of women who work in each
occupation.
Uses nlsw.dta & scheme economist
Prof
Mgmt
Sales
Cler.
Operat.
Labor
Other
13.58%
14.11%
12.73%
11.75%
10.95%
4.541%
32.32%
The electronic form of this topic is solely for direct use at UCLA and only by faculty, students, and staff of UCLA.