Graphics Reference
In-Depth Information
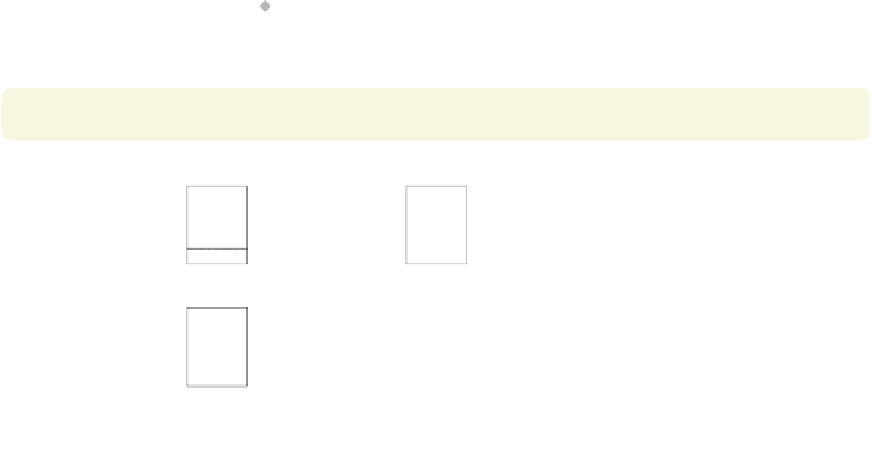
graph dot ttl exp tenure, over(married) over(urban2)
by(union,
missing
)
We can use the
missing
option to
include a panel for the missing values of
union
. Note that we changed the first
over()
variable to be
over(married)
to make an example that was more
readable.
Uses nlsw.dta & scheme vg s1m
nonunion
union
single
single
Rural
Rural
married
married
single
single
Metro
Metro
married
married
0
5
10
15
(missing)
single
Rural
married
single
Metro
married
0
5
10
15
mean of ttl_exp
mean of tenure
Graphs by union worker
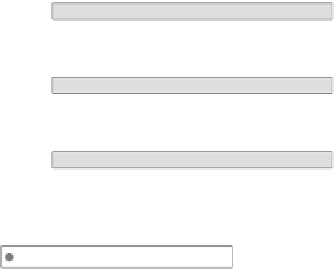
graph dot ttl exp tenure, over(married) over(collgrad)
by(union,
total
)
We can add the
total
option to include
a panel for all observations.
Uses nlsw.dta & scheme vg s1m
nonunion
union
single
single
not college grad
not college grad
married
married
single
single
college grad
college grad
married
married
0
5
10 15
Total
single
not college grad
married
single
college grad
married
0
5
10 15
mean of ttl_exp
mean of tenure
Graphs by union worker
graph dot ttl exp tenure, over(married) over(collgrad)
by(union, total
cols(1)
)
We can use the
cols(1)
option to show
the graphs in one column.
Uses nlsw.dta & scheme vg s1m
nonunion
single
not college grad
married
single
college grad
married
union
single
not college grad
married
single
college grad
married
Total
not college grad
single
married
single
college grad
married
0
5
10
15
mean of ttl_exp
mean of tenure
Graphs by union worker
The electronic form of this topic is solely for direct use at UCLA and only by faculty, students, and staff of UCLA.