Graphics Reference
In-Depth Information
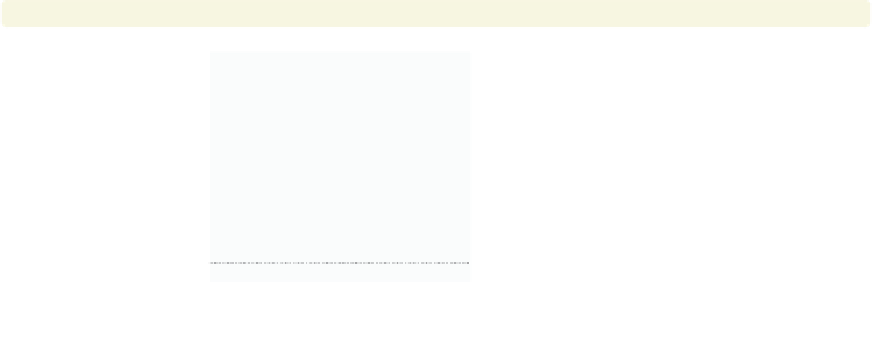
graph dot
(median)
prev exp tenure, over(occ7) over(collgrad)
So far, all the examples we have seen
have graphed the mean of
y
-variable(s).
Prof
Mgmt
Here, we preface the
-variables with
(median)
, plotting the median for each
y
y
Sales
not college grad
Cler.
Operat.
Labor
-variable.
Uses nlsw.dta & scheme vg outc
Other
Prof
Mgmt
Sales
college grad
Cler.
Operat.
Labor
Other
0
2
4
6
8
10
p 50 of prev_exp
p 50 of tenure
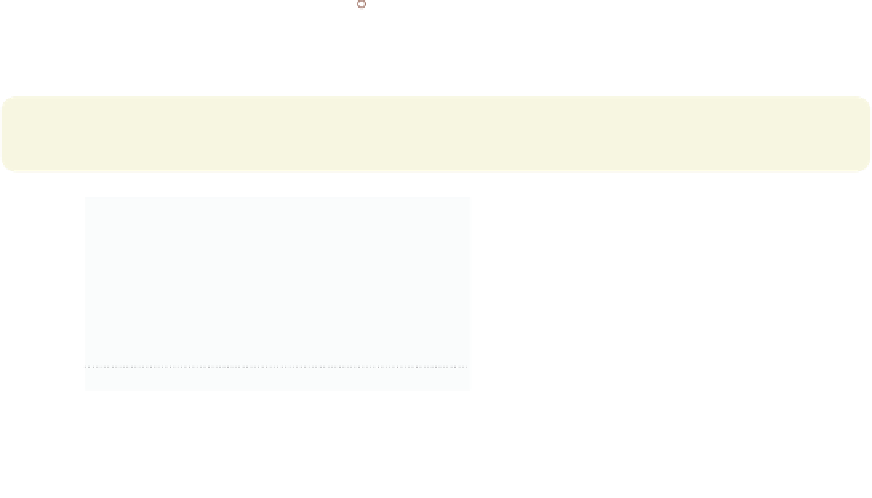
graph dot
(p10) wage p10=wage (p25) wage p25=wage
(p50) wage p50=wage (p75) wage p75=wage (p90) wage p90=wage
,
over(occ7)
You can request different statistics for
the same variable, such as in this
example, which shows the 10th, 25th,
50th, 75th, and 90th percentiles of
wages broken down by occupation.
Uses nlsw.dta & scheme vg outc
Prof
Mgmt
Sales
Cler.
Operat.
Labor
Other
0
5
10
15
20
p 10 of wage
p 25 of wage
p 50 of wage
p 75 of wage
p 90 of wage
Now, let's consider options that can be used in combination with the
over()
option to
customize the behavior of the graphs. We show how you can treat the levels of the first
over()
option as though they were multiple
-variables. You can also request that missing
values for the levels of the
over()
variables be displayed, and you can suppress empty cat-
egories when multiple
over()
options are used. These examples are shown below using the
vg s2m
scheme.
y
The electronic form of this topic is solely for direct use at UCLA and only by faculty, students, and staff of UCLA.