Graphics Reference
In-Depth Information
graph hbox ttl exp tenure, nooutsides note("")
over(urban2) over(married) by(union,
total row(1)
)
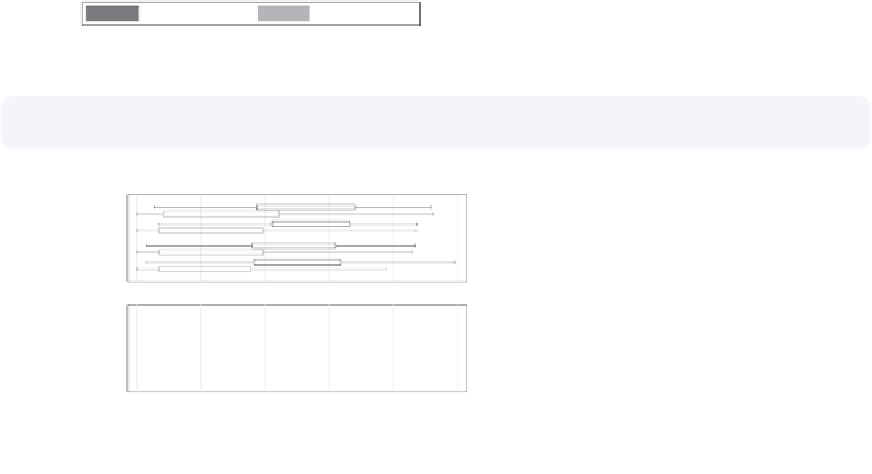
Switching to a vertical box chart, we
can use the
rows(1)
option to show the
multiple graphs in one row.
Uses nlsw.dta & scheme vg s1m
nonunion
union
Total
Rural
Rural
Rural
single
single
single
Metro
Metro
Metro
Rural
Rural
Rural
married
married
married
Metro
Metro
Metro
0511225
0511225
0511225
Tot. work exper.
Curr. work exper.
Graphs by union worker
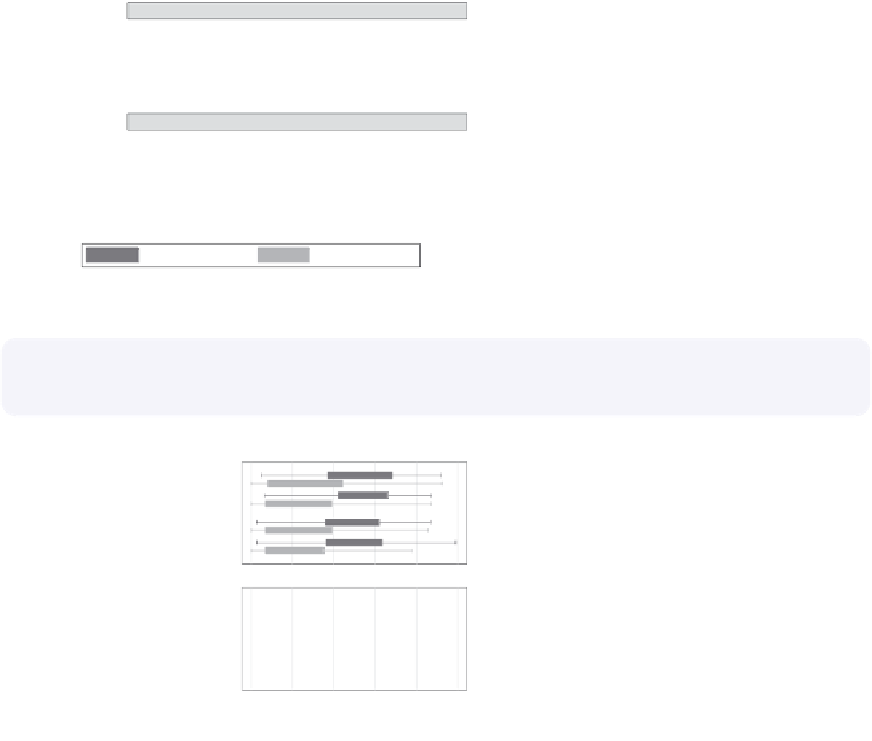
graph hbox ttl exp tenure, nooutsides note("")
over(urban2) over(married) by(union,
cols(1)
)
Here, we flip the graph back to a
horizontal box chart and use the
cols(1)
option to show both graphs in
one column.
Uses nlsw.dta & scheme vg s1m
nonunion
Rural
single
Metro
Rural
married
Metro
union
Rural
single
Metro
Rural
married
Metro
0
5
10
15
20
25
Tot. work exper.
Curr. work exper.
Graphs by union worker
graph hbox ttl exp tenure, nooutsides note("")
over(urban2) over(married) by(union, cols(1)
legend(position(9))
)
legend(cols(1) stack)
To make the last graph more readable,
we can add the
legend(pos(9))
within
the
by()
option to put the legend at 9
o'clock and
legend(cols(1) stack)
to
make the legend one stacked column.
Adding
note("")
suppresses the note
about outside values being omitted.
Uses nlsw.dta & scheme vg s1m
nonunion
Rural
single
Metro
Rural
married
Metro
Tot. work exper.
union
Rural
Curr. work exper.
single
Metro
Rural
married
Metro
0
5
10
15
20
25
Graphs by union worker
The electronic form of this topic is solely for direct use at UCLA and only by faculty, students, and staff of UCLA.