Graphics Reference
In-Depth Information
graph box prev exp tenure ttl exp, nooutsides over(collgrad)
boxgap(10)
The
boxgap()
option controls the size
of the gap among the boxes formed by
the multiple
25
-variables. The default
value is 33, meaning that the distance
between the boxes is 33% of the width
of the boxes. Here, we make the gap
smaller, making the boxes for the
y
y
20
15
10
5
-variables closer to each other.
Uses nlsw.dta & scheme vg blue
0
not college grad
college grad
Prev. work exper.
Curr. work exper.
Tot. work exper.
excludes outside values
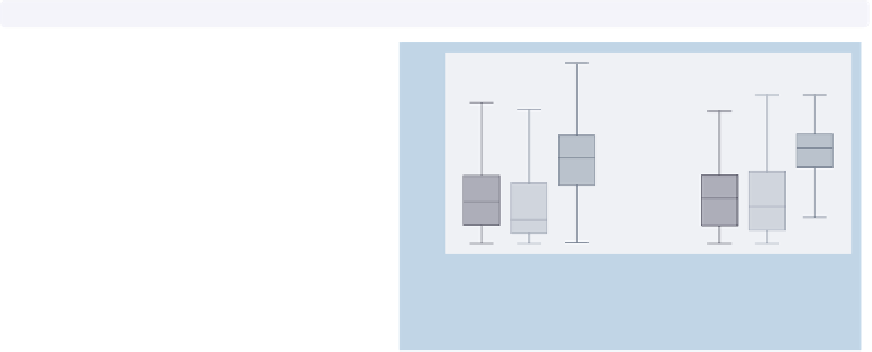
graph box prev exp tenure ttl exp, nooutsides over(collgrad,
gap(*3)
)
Here, we use the
gap()
option to
control the gap between the college
graduate group and the noncollege
graduate group. Here, we make the gap
three times the width of a box. See
Box : Over options
(163) for more
information about controlling the gap
among boxes created by the
over()
option.
Uses nlsw.dta & scheme vg blue
25
20
15
10
5
0
not college grad
college grad
Prev. work exper.
Curr. work exper.
Tot. work exper.
excludes outside values
Let's now look at options that allow us to control the color of the boxes. We will first
look at options that control the overall intensity of the color for all the boxes and then show
how you can control the color of each box. We will use the
vg s2c
scheme for the following
examples.
The electronic form of this topic is solely for direct use at UCLA and only by faculty, students, and staff of UCLA.