Graphics Reference
In-Depth Information
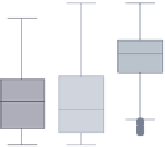
graph box prev exp tenure ttl exp, over(collgrad)
Consider this box chart, which shows
the distribution of previous work
experience, current work experience,
and total work experience. These three
variables are broken down by whether
one graduated college.
Uses nlsw.dta & scheme vg blue
30
20
10
0
not college grad
college grad
Prev. work exper.
Curr. work exper.
Tot. work exper.
graph box prev exp tenure ttl exp,
nooutsides
over(collgrad)
We add the
nooutsides
option to
suppress the display of outside values.
We will use this option for most of the
graphs in this section.
Uses nlsw.dta & scheme vg blue
25
20
15
10
5
0
not college grad
college grad
Prev. work exper.
Curr. work exper.
Tot. work exper.
excludes outside values
graph box prev exp tenure ttl exp, nooutsides over(collgrad)
outergap(*5)
We can change the outer gap between
the boxes and the edge of the plot area
with the
outergap()
option. Here, the
gap is five times its normal size. You
could also supply a value less than 1 to
shrink the size of the outer gap.
Uses nlsw.dta & scheme vg blue
25
20
15
10
5
0
not college grad
college grad
Prev. work exper.
Curr. work exper.
Tot. work exper.
excludes outside values
The electronic form of this topic is solely for direct use at UCLA and only by faculty, students, and staff of UCLA.