Graphics Reference
In-Depth Information
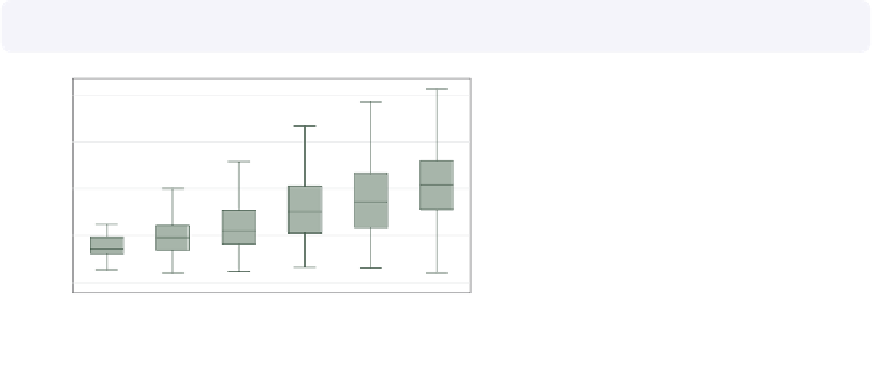
graph box wage, over(grade6) nooutsides
b1title("Level of Education") b2title("in six categories")
In this example, the categorical axis
represents the level of education, and
we can use the
b1title()
and
b2title()
options to add titles to the
bottom of the graph. See
Standard
options : Titles
(313) for more details.
Uses nlsw.dta & scheme vg s1c
No HS
Some HS
HS Grad
Some Coll
Coll Grad
Post Grad
Level of Education
in six categories
excludes outside values
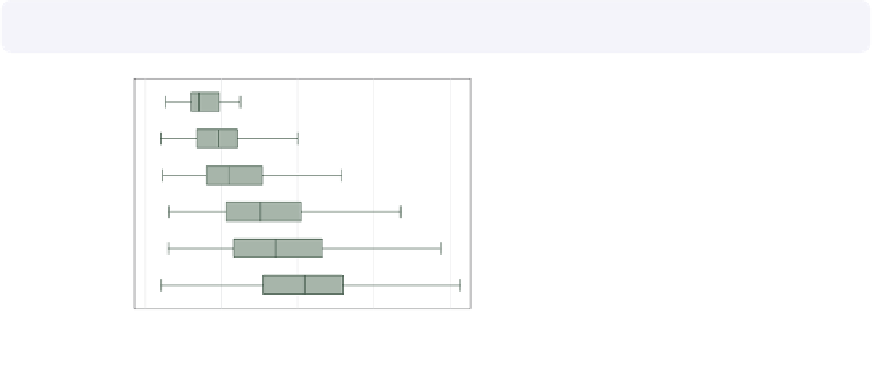
graph
hbox
wage, over(grade6) nooutsides
l1title("Level of Education" "in six categories")
By using
graph
hbox
, the categorical
axis is now on the left axis, so we then
use the
l1title()
to add a title to the
x
No HS
Some HS
-axis. We could also use the
l2title()
to add a second title as well.
Uses nlsw.dta & scheme vg s1c
HS Grad
Some Coll
Coll Grad
Post Grad
0
5
10
15
20
hourly wage
excludes outside values
5.4
Controlling legends
This section discusses the use of legends for box charts, emphasizing the features that
are unique to box charts. The section
Options : Legend
(287) goes into great detail about
legends, as does [
G
]
legend option
. Legends can be used for multiple
y
-variables or when
-variable via the
asyvars
option. See
Box : Yvars
and over
(157) for more information about using multiple
y
the first
over()
variable is treated as a
y
-variables and more examples
of treating the first
over()
variable as a
y
-variable. These first examples use the
vg brite
scheme.
The electronic form of this topic is solely for direct use at UCLA and only by faculty, students, and staff of UCLA.