Graphics Reference
In-Depth Information
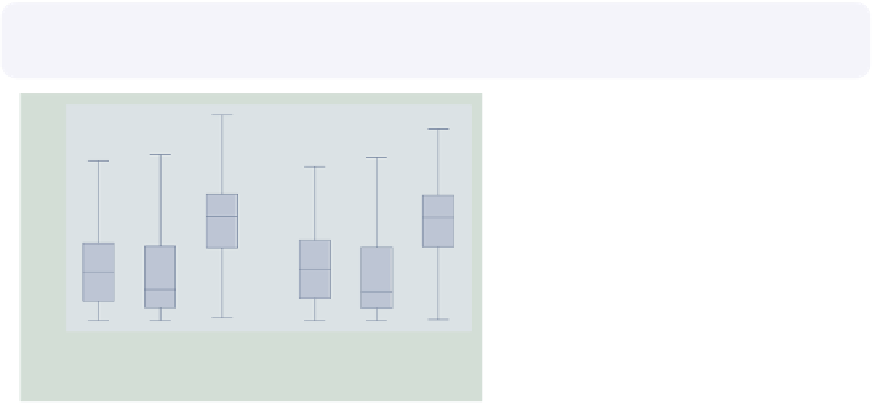
graph box prev exp tenure ttl exp, nooutsides ascategory
over(south, relabel(1 "N & W" 2 "South"))
yvaroptions(relabel(1 "Prev Exp" 2 "Curr Exp" 3 "Tot Exp"))
This example is similar to the previous
example, but we have added an
over()
variable as well. As before, we use
yvaroptions(relabel())
to modify
the labels for the multiple
25
20
-variables,
and then we also use the
relabel()
option within the
over()
option to
change the labels for
south
.
Uses nlsw.dta & scheme vg teal
y
15
10
5
0
Prev Exp
Curr Exp
Tot Exp
Prev Exp
Curr Exp
Tot Exp
N & W
South
excludes outside values
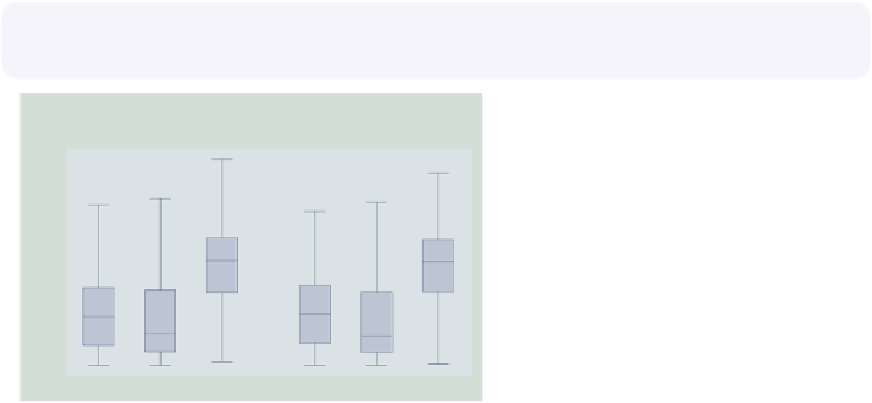
graph box prev exp tenure ttl exp, nooutsides ascategory
xalternate
over(south, relabel(1 "N & W" 2 "South"))
yvaroptions(relabel(1 "Prev Exp" 2 "Curr Exp" 3 "Tot Exp"))
We add the
xalternate
option, which
moves the labels for the
N & W
South
x
-axis to the
opposite side, in this case from the
bottom to the top. You can also use
the
yalternate
option to move the
y
Prev Exp
Curr Exp
Tot Exp
Prev Exp
Curr Exp
Tot Exp
25
20
-axis to its opposite side.
Uses nlsw.dta & scheme vg teal
15
10
5
0
excludes outside values
In the examples above, we have seen that, even though the
relabel()
option is called
an
over()
option, it can be used within
yvaroptions()
to control the labeling of multiple
y
-variables
into categories). We will next explore other
over()
options, which also can be used with
either
over()
or
yvaroptions()
. These examples will use the
vg rose
scheme.
-variables (provided that the
ascategory
option is used to convert the multiple
y
The electronic form of this topic is solely for direct use at UCLA and only by faculty, students, and staff of UCLA.