Graphics Reference
In-Depth Information
Now, let's consider options that may be used in combination with the
over()
option
to customize the behavior of the graphs. We show how you can treat the levels of the first
over()
option as though they were multiple
-variables. You can also request that missing
values for the levels of the
over()
variables be displayed, and you can suppress empty cat-
egories when multiple
over()
options are used. These examples are shown below using the
vg s2m
scheme.
y
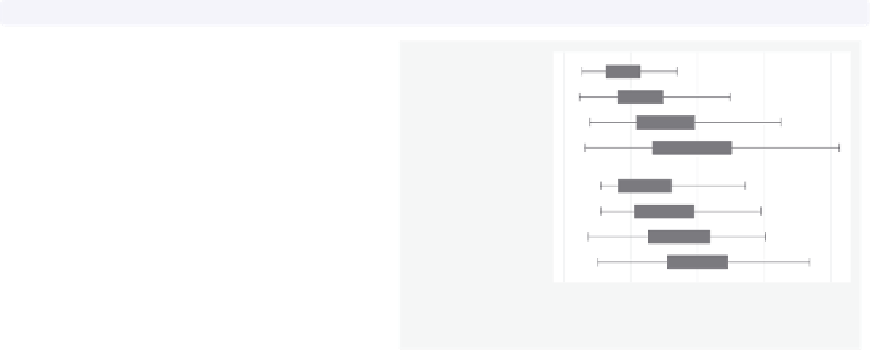
graph hbox wage, nooutsides over(grade4) over(union)
Consider this graph where we show
wages
broken down by education level
and whether one belongs to a union.
Uses nlsw.dta & scheme vg s2m
Not HS
HS Grad
nonunion
Some Coll
Coll Grad
Not HS
HS Grad
union
Some Coll
Coll Grad
0
5
10
15
20
hourly wage
excludes outside values
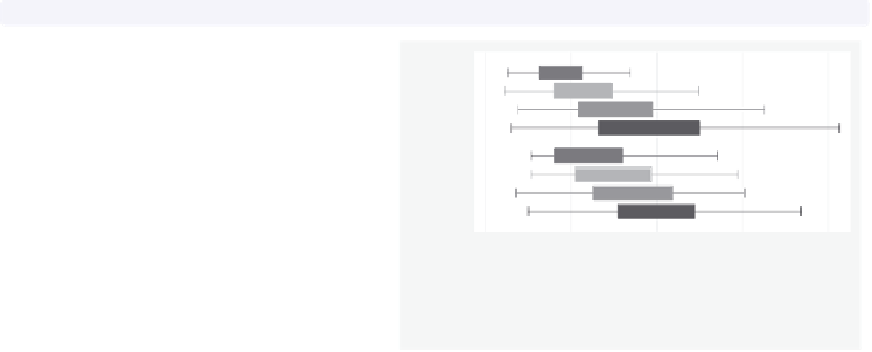
graph hbox wage, nooutsides over(grade4) over(union)
asyvars
If we add the
asyvars
option, then the
first
over()
variable (
grade4
)is
graphed as if there were four
-variables
corresponding to each level of
grade4
.
Each level of
grade4
is shown as a
differently colored/shaded box and
labeled using the legend.
Uses nlsw.dta & scheme vg s2m
y
nonunion
union
0
5
10
15
20
hourly wage
Not HS
HS Grad
Some Coll
Coll Grad
excludes outside values
The electronic form of this topic is solely for direct use at UCLA and only by faculty, students, and staff of UCLA.