Graphics Reference
In-Depth Information
graph bar wage hours ttl exp tenure, over(collgrad)
bar(1, bcolor(dkgreen))
Here, we use the
bar()
option to make
the color of the first bar dark green.
See
Styles : Colors
(328) for more
information about colors you can select.
Uses nlsw.dta & scheme vg s2c
not college grad
college grad
mean of wage
mean of hours
mean of ttl_exp
mean of tenure
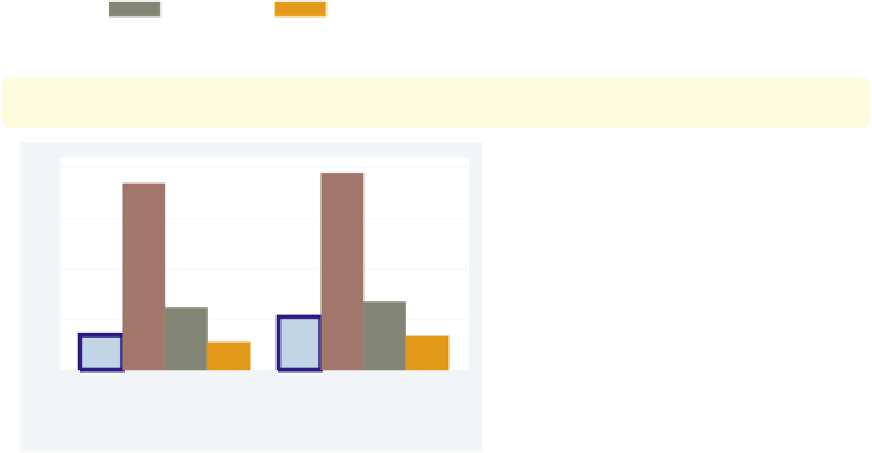
graph bar wage hours ttl exp tenure, over(collgrad)
bar(1,
bfcolor(ltblue) blcolor(blue) blwidth(vthick)
)
In this example, we make the fill color
of the first bar light blue and the
outline very thick and blue. See
Styles : Linewidth
(337) for more details
on controlling the thickness of lines.
You could also use the
blpattern()
option to control the pattern of the line
surrounding the bar; see
Styles : Linepatterns
(336) for more
details.
Uses nlsw.dta & scheme vg s2c
not college grad
college grad
mean of wage
mean of hours
mean of ttl_exp
mean of tenure
graph bar wage hours ttl exp tenure, over(collgrad)
While you can use the
bar()
option to
control the look of each bar, selecting a
different scheme allows you to control
the look of all of the bars. For example,
this graph is drawn using the
vg palec
scheme. See
Intro : Schemes
(14) for
some other schemes you could try and
Appendix : Customizing schemes
(379) for
tips on customizing your own schemes.
Uses nlsw.dta & scheme vg palec
not college grad
college grad
mean of wage
mean of hours
mean of ttl_exp
mean of tenure
The electronic form of this topic is solely for direct use at UCLA and only by faculty, students, and staff of UCLA.