Graphics Reference
In-Depth Information
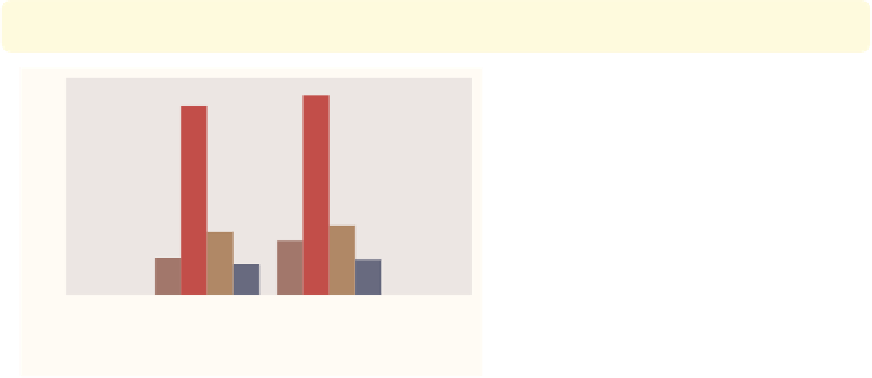
graph bar wage hours ttl exp tenure, over(collgrad)
outergap(*15)
We can change the outer gap between
the bars and the edge of the plot area
with the
outergap()
option. Here, the
gap is fifteen times its normal size. You
can also supply values less than 1 to
shrink the size of the gap.
Uses nlsw.dta & scheme vg rose
40
30
20
10
0
not college grad
college grad
mean of wage
mean of hours
mean of ttl_exp
mean of tenure
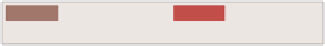
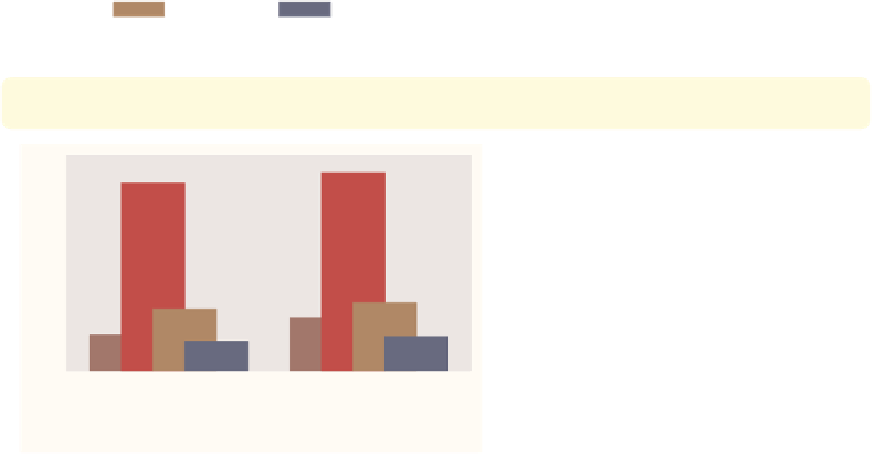
graph bar wage hours ttl exp tenure, over(collgrad)
bargap(25)
The
bargap()
option controls the size
of the gap between the bars. The
default value is 0, meaning that the
bars touch exactly. Here, we make the
gap 25% of the width of the bars.
Uses nlsw.dta & scheme vg rose
40
30
20
10
0
not college grad
college grad
mean of wage
mean of hours
mean of ttl_exp
mean of tenure
graph bar wage hours ttl exp tenure, over(collgrad)
bargap(-50)
The
bargap()
option permits negative
values to indicate that you want the
bars to overlap. Here, we make the bars
overlap by 50% of the size of the bars.
Uses nlsw.dta & scheme vg rose
40
30
20
10
0
not college grad
college grad
mean of wage
mean of hours
mean of ttl_exp
mean of tenure
The electronic form of this topic is solely for direct use at UCLA and only by faculty, students, and staff of UCLA.