Graphics Reference
In-Depth Information
repetitive to go into detail about legends for bar charts, box plots, and so on. Within each
kind of graph, legends are briefly described and illustrated, but the details are described in
the
Options
chapter in the section titled
Legend
. This is cross-referenced in the topic by
saying something like “for more details, see
Options : Legend
(287)”, which indicates that
you should look to the
Visual Table of Contents
and thumb to the
Options
chapter and
then to the
Legend
section, which begins on page 287.
Sometimes it may take an extra cross-reference to get the information you need. Say
that you want to make the
ytitle()
large for a bar chart, so you first consult
Bar : Y-axis
(143). This gives you some information about using
ytitle()
, but then that section refers
you to
Options : Axis titles
(254), where more details about axis titles are described. This
section then refers you to
Options : Textboxes
(303) for more complete details about options
you can use to control the display of text. That section shows more details but then refers to
Styles : Textsize
(344), where all of the possible text sizes are described. I know this sounds
like a lot of jumping around, but I hope that it feels more like drilling down for additional
detail, that you feel you are in control of the level of detail that you want, and that the
Visual Table of Contents
eases the process of getting the additional details.
Most pages of this topic have three graphs per page, each graph being composed of
the graph itself, the command that produced it, and some descriptive text. An example is
shown below, followed by some points to note.
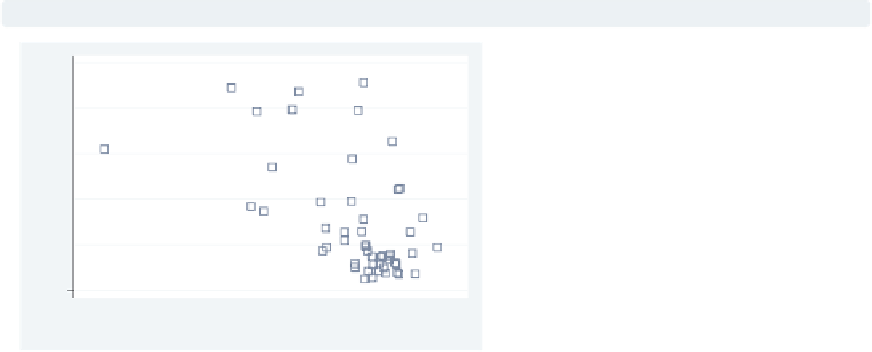
graph twoway scatter propval100 ownhome,
msymbol(Sh)
In this example, we use the
msymbol()
(marker symbol) option to make the
symbols large hollow squares; see
Options : Markers
(235) for more details.
Note that the
msymbol()
option is only
useful for the types of graphs that have
marker symbols, and Stata will ignore
this option if you use it with a
command like the
graph twoway
histogram
command.
Uses allstates.dta & scheme vg s2c
40
50
60
70
80
% who own home
•
Note that the command itself is displayed in a
typewriter font
, and the part of
the command we are discussing (i.e.,
msymbol(Sh)
)isin
this color
, both in the
command and when referenced in the descriptive text.
•
When commands or parts of commands are given in the descriptive text (e.g.,
graph
twoway histogram
), they are displayed in
typewriter font
.
•
Many of the descriptions contain cross-references, for example,
Options : Markers
(235),
which means to flip to the
Options
chapter and then to the section
Markers
. Equiva-
lently, go to page 235.
•
The names of some options are shorthand for two or more words that are sometimes
explained; for instance, “we use the
msymbol()
(marker symbol) option to make ...”.
The electronic form of this topic is solely for direct use at UCLA and only by faculty, students, and staff of UCLA.