Graphics Reference
In-Depth Information
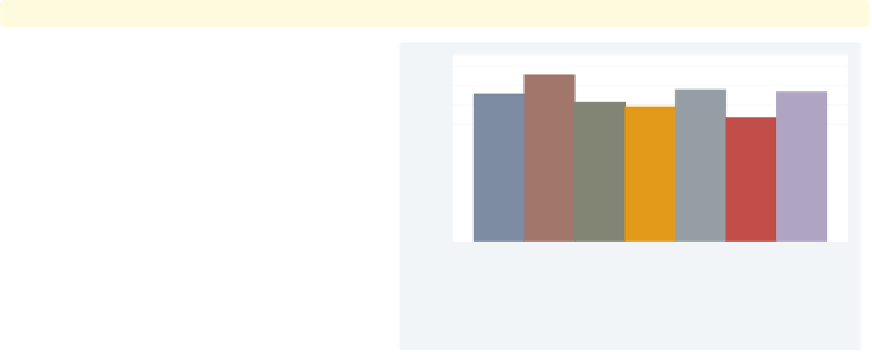
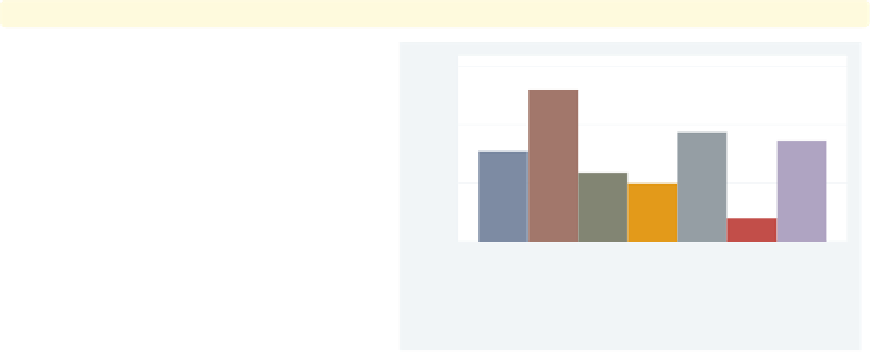
graph bar hours, over(occ7) asyvar
ylabel(30(5)45)
We can use the
ylabel()
option to
label the
y
-axis. In this case, we label
-axis from 30 to 45 by increments
of 5. See
Options : Axis labels
(256) and
[
G
]
axis label options
for more
details. Please disregard any references
to
xlabel()
since that option is not
valid when using
graph bar
. Note that
the
the
y
-axis still begins at 0. See the
following example to see how you can
control that.
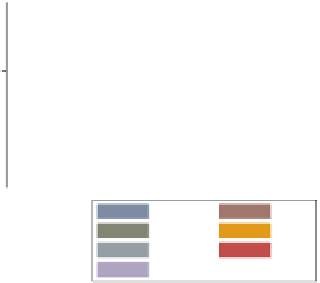
Uses nlsw.dta & scheme vg s2c
y
Prof
Mgmt
Sales
Cler.
Operat.
Labor
Other
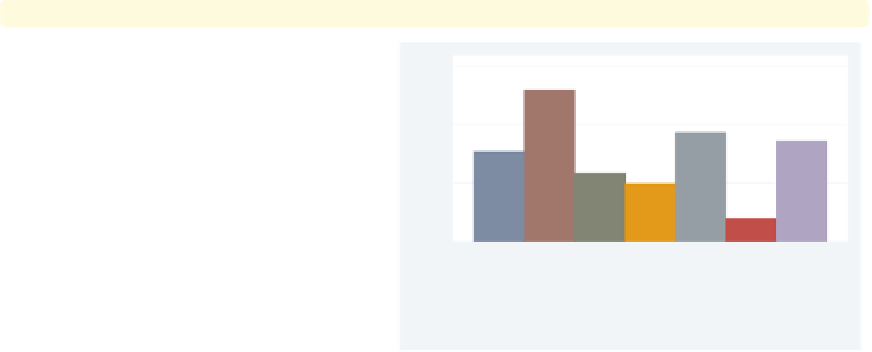
graph bar hours, over(occ7) asyvar ylabel(30(5)45)
exclude0
By default, bar charts include 0 on the
y
-axis, unless you specify the
exclude0
option, as we do here.
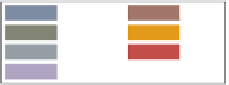
Uses nlsw.dta & scheme vg s2c
Prof
Mgmt
Sales
Cler.
Operat.
Labor
Other
graph bar hours, over(occ7) asyvar ylabel(30(5)45,
angle(0)
) exclude0
We can add the
angle()
option to
modify the angle of the
45
y
-label, making
the labels for the
y
-axis horizontal (zero
degrees).
Uses nlsw.dta & scheme vg s2c
40
35
30
Prof
Mgmt
Sales
Cler.
Operat.
Labor
Other
The electronic form of this topic is solely for direct use at UCLA and only by faculty, students, and staff of UCLA.