Graphics Reference
In-Depth Information
graph hbar wage, over(occ5) over(married) asyvar
ytitle("Years of" "experience")
Splitting the title into two separate
quoted strings displays the title on
separate lines. Note that, when using
graph hbar
, the title of the
single
y
-axis now
appears at the bottom.
Uses nlsw.dta & scheme vg s2c
married
0
5
10
15
Years of
experience
Prof/Mgmt
Sales
Clerical
Labor/Ops
Other
graph hbar wage, over(occ5) over(married) asyvar
ytitle("Years of" "experience",
size(vlarge) box bexpand
)
Because this title is considered to be a
textbox, you can use a variety of
textbox options to control the look of
the title. In this example, the title is
made large with a box around it, and
the
bexpand
(box expand) makes the
box expand to fill the width of the plot
area. See
Options : Textboxes
(303) for
additional examples of how to use
textbox options to control the display
of text.
Uses nlsw.dta & scheme vg s2c
single
married
0
5
10
15
Years of
experience
Prof/Mgmt
Sales
Clerical
Labor/Ops
Other
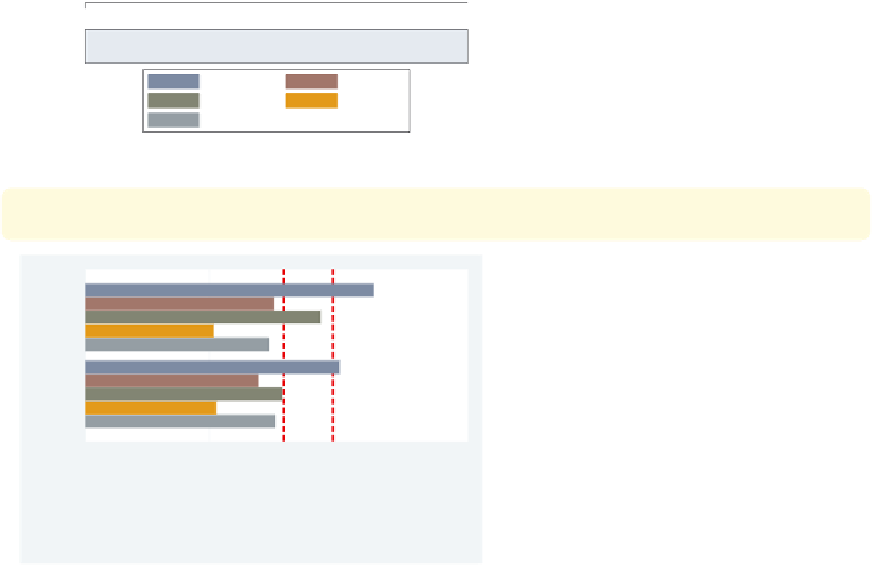
graph hbar wage, over(occ5) over(married) asyvar
yline(8 10, lwidth(thick) lcolor(red) lpattern(dash))
The
yline()
option is used to place a
thick, red, dashed line on the graph
where
equals 8 and 10. Note that this
option is still called
yline()
since the
y
y
single
-axis is the axis with the continuous
variable.
Uses nlsw.dta & scheme vg s2c
married
0
5
10
15
mean of wage
Prof/Mgmt
Sales
Clerical
Labor/Ops
Other
The electronic form of this topic is solely for direct use at UCLA and only by faculty, students, and staff of UCLA.