Graphics Reference
In-Depth Information
4.6
Controlling the y-axis
This section describes options you can use to control the
y
-axis in bar charts. To be
precise, when Stata refers to the
-axis on a bar chart, it refers to the axis with the con-
tinuous variable, whether the left axis when using
graph bar
or the bottom axis when
using
graph hbar
. This section emphasizes the features that are particularly relevant to
bar charts. For more details, see
Options : Axis titles
(254),
Options : Axis labels
(256), and
Options : Axis scales
(265). Also see [
G
]
axis title options
,[
G
]
axis label options
,and
[
G
]
axis scale options
. This section uses the
vg s2c
scheme.
y
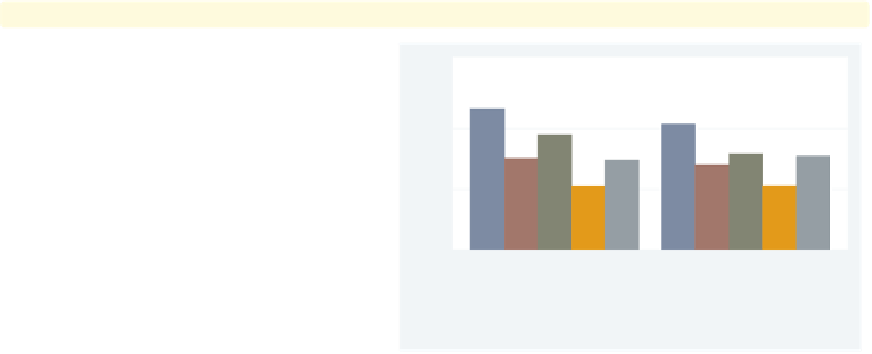
graph bar wage, over(occ5) over(married) asyvar
Consider this graph showing the mean
hourly wage broken down by
occupation and marital status.
Uses nlsw.dta & scheme vg s2c
single
married
Prof/Mgmt
Sales
Clerical
Labor/Ops
Other
graph bar wage, over(occ5) over(married) asyvar
ytitle("Years of experience")
We can use the
ytitle()
option to add
a title to the
-axis. See
Options : Axis titles
(254) and
[
G
]
axis title options
for more details,
but please disregard any references to
xtitle()
since that option is not valid
when using
graph bar
.
Uses nlsw.dta & scheme vg s2c
y
single
married
Prof/Mgmt
Sales
Clerical
Labor/Ops
Other
The electronic form of this topic is solely for direct use at UCLA and only by faculty, students, and staff of UCLA.