Graphics Reference
In-Depth Information
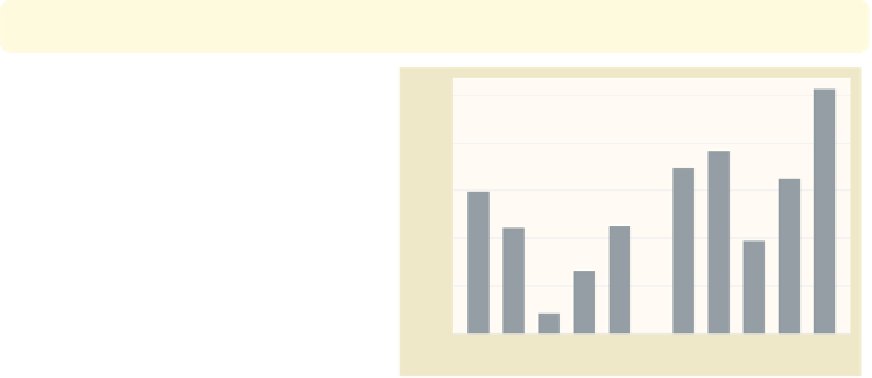
graph bar tenure, over(occ5, label(nolabels)) exclude0 blabel(group)
yscale(range(7.2))
over(union)
Even if we add a second
over()
option,
the levels of the first
over()
variable
are labeled at the top of each bar due to
the
blabel()
option, and the levels of
the second
over()
variable are labeled,
as usual, at the bottom of the bars.
Note that the
blabel()
option does
not work this way when you have three
over()
options or multiple
Other
Sales
Prof/Mgmt
Labor/Ops
P
rof/Mgmt
Other
Sales
Clerical
Labor/Ops
-variables.
Uses nlsw.dta & scheme vg past
y
Clerical
nonunion
union
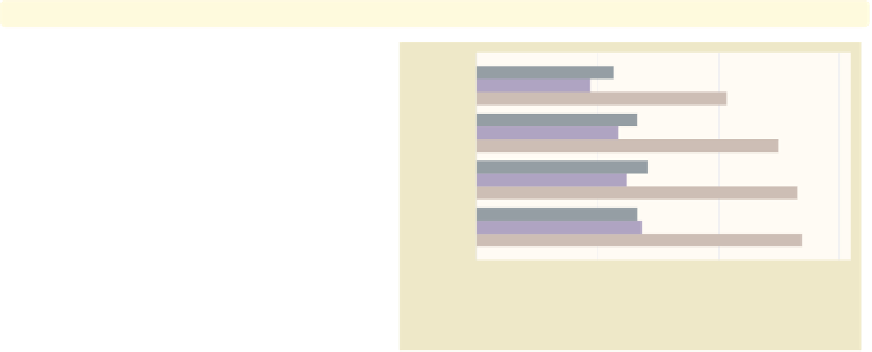
graph hbar prev exp tenure ttl exp, over(grade4)
blabel(bar)
Consider this graph showing previous,
current, and total work experience
broken down by education. In this
example, the
blabel(bar)
option is
used to display the bar height (in this
case, the mean of
5.66887
Not HS
4.7191
10.347
6.64033
HS Grad
5.84232
12.4683
7.06569
-variables).
Uses nlsw.dta & scheme vg past
y
Some Coll
6.21637
13.2673
6.64236
Coll Grad
6.81536
13.441
0
5
10
15
mean of prev_exp
mean of tenure
mean of ttl_exp
graph bar
(sum)
prev exp tenure, stack over(grade4) blabel(bar)
Using the
(sum)
function, this graph
shows the sum of experience for all
individuals in a grade level before their
current job (
prev exp
) and the sum of
experience for all individuals in a grade
level in their current job (
tenure
)and
then uses
stack
to stack these two
totals. With the
blabel(bar)
option,
the bar labels are the sums for each
y
5474.25
3475.83
6221.99
2803.58
1552.58
3387.6
3186.63
1865.06
-variables broken down by
grade4
.
Uses nlsw.dta & scheme vg past
Not HS
HS Grad
Some Coll
Coll Grad
sum of prev_exp
sum of tenure
The electronic form of this topic is solely for direct use at UCLA and only by faculty, students, and staff of UCLA.