Graphics Reference
In-Depth Information
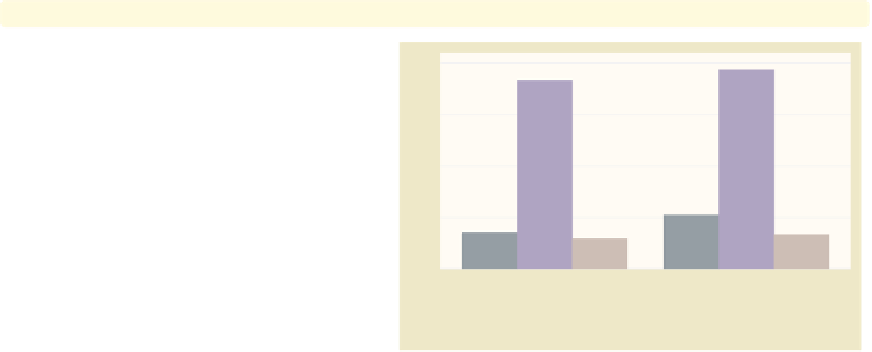
graph bar wage hours tenure, over(collgrad)
Consider this graph, where we look at
wage
,
hours
,and
tenure
broken down
by the levels of
collgrad
. The legend
identifies the bars for us. In addition to
the legend, Stata offers us other ways
we can label these bars, as we shall see
in the upcoming examples.
Uses nlsw.dta & scheme vg past
not college grad
college grad
mean of wage
mean of hours
mean of tenure
graph bar wage hours tenure, over(collgrad)
blabel(name)
We can add the
blabel(name)
(bar
label) option, and it places labels on
each of the bars with the name of
y
mean of hours
mean of hours
-variables. Here, each of these labels is
preceded with “mean of” since each bar
represents the mean of
-variable.
Uses nlsw.dta & scheme vg past
y
mean of wage
mean of wage
mean of tenure
mean of tenure
not college grad
college grad
mean of wage
mean of hours
mean of tenure
graph bar wage hours tenure, over(collgrad) blabel(name)
nolabel
If we use the
nolabel
option, just the
name
hours
y
-variable is shown. For example,
instead of showing the variable label
hourly wage
, it shows the variable
name
wage
.
Uses nlsw.dta & scheme vg past
hours
wage
wage
tenure
tenure
not college grad
college grad
wage
hours
tenure
The electronic form of this topic is solely for direct use at UCLA and only by faculty, students, and staff of UCLA.