Graphics Reference
In-Depth Information
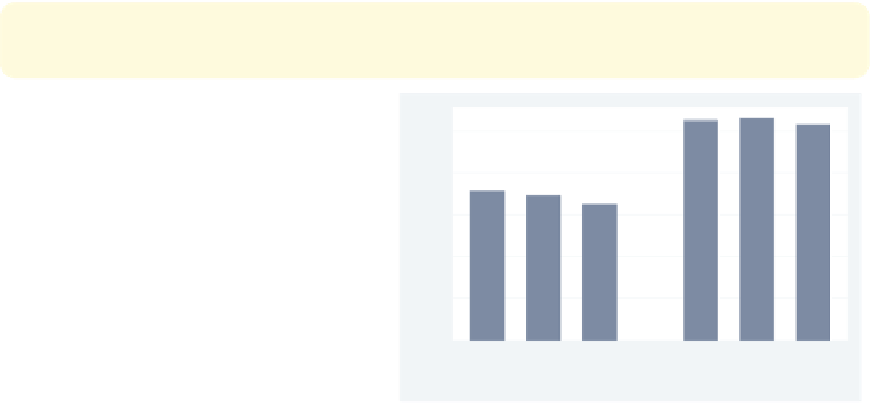
graph bar wage,
over(age3, label(
ticks tlwidth(thick) tlength(*2) tposition(crossing)
))
over(collgrad)
Stata permits you to add ticks using
the
ticks
option. At the same time, we
modify the attributes of the ticks,
making the tick line width thick, the
tick length twice as long as normal, and
the tick position crossing the
-axis.
See [
G
]
cat axis label options
for
more details and other options for
controlling ticks.
Uses nlsw.dta & scheme vg s2c
x
34/37
38/41
42/46
34/37
38/41
42/46
not college grad
college grad
graph bar wage, over(age3, label(
labgap(*5))
) over(collgrad)
The
labgap(*5)
option increases the
gap between the label and the axis,
making the gap between the labels for
the levels of
age3
and the axis five
times their normal size.
Uses nlsw.dta & scheme vg s2c
34/37
38/41
42/46
34/37
38/41
42/46
not college grad
college grad
graph bar wage, over(age3) over(collgrad,
label(labgap(*5))
)
We use the
label(labgap(*5))
option
to control the gap between the labels
for
age3
and
collgrad
, making that
gap five times the normal size.
Uses nlsw.dta & scheme vg s2c
34/37
38/41
42/46
34/37
38/41
42/46
not college grad
college grad
The electronic form of this topic is solely for direct use at UCLA and only by faculty, students, and staff of UCLA.