Graphics Reference
In-Depth Information
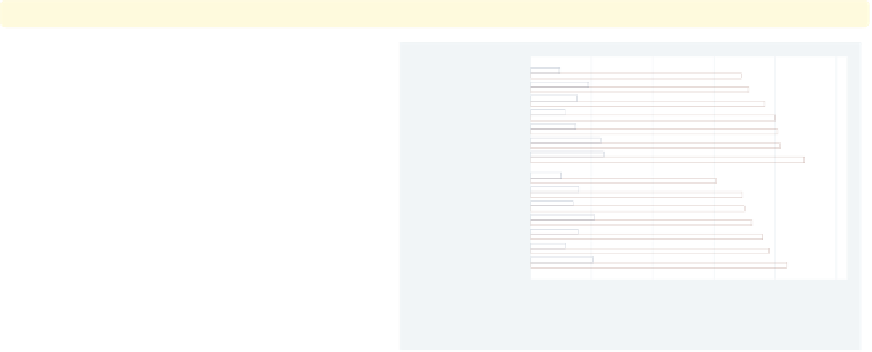
graph hbar wage hours, over(occ7,
sort(1)
)
Here, we plot two
-variables. In
addition to wages, we also show the
average hours worked per week.
Including the
sort(1)
option sorts the
bars according to the mean of
wage
since that is the first
y
Labor
Operat.
Sales
Other
-variable.
Uses nlsw.dta & scheme vg s2c
y
Cler.
Prof
Mgmt
0
10
20
30
40
mean of wage
mean of hours
graph hbar wage hours, over(occ7,
sort(2)
)
Changing
sort(1)
to
sort(2)
sorts the
bars according to the second
y
-variable,
Labor
the mean of
hours
.
Uses nlsw.dta & scheme vg s2c
Cler.
Sales
Prof
Other
Operat.
Mgmt
0
10
20
30
40
mean of wage
mean of hours
graph hbar wage hours, over(occ7,
sort(2)
) over(married)
We can use the
sort()
option when
there are additional
over()
variables.
Here, the
sort(2)
option orders the
bars according to the mean number of
hours worked within each level of
married
.
Uses nlsw.dta & scheme vg s2c
Labor
Cler.
Sales
single
Operat.
Other
Prof
Mgmt
Labor
Cler.
Sales
married
Prof
Other
Operat.
Mgmt
0
10
20
30
40
50
mean of wage
mean of hours
The electronic form of this topic is solely for direct use at UCLA and only by faculty, students, and staff of UCLA.