Graphics Reference
In-Depth Information
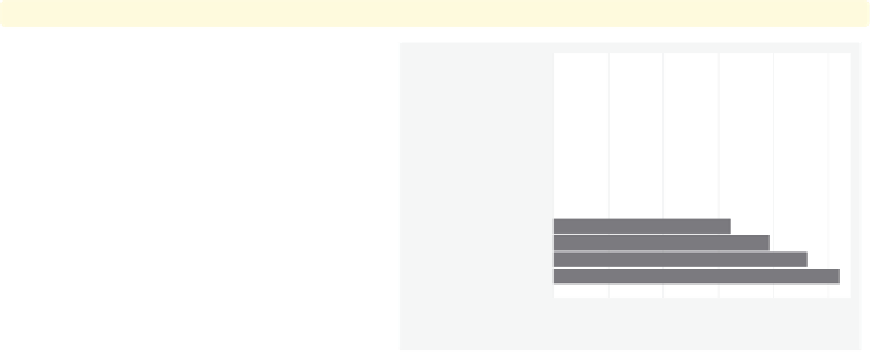
graph hbar wage, over(grade4,
gap(*.2)
) over(union,
gap(*3)
)
We can control the gap with respect to
each of the
over()
variables at the
same time. In this example, we make
the gap among the
grade4
categories
smaller (20% their original size) and
the gap between the levels of
union
larger (three times the normal size).
Uses nlsw.dta & scheme vg s2m
Not HS
HS Grad
nonunion
Some Coll
Coll Grad
Not HS
HS Grad
union
Some Coll
Coll Grad
0
2
4
6
8
10
mean of wage
So far, we have let Stata control the order in which the bars are displayed. By default,
the bars formed by
over()
variables are ordered in ascending sequence according to the
values of the
over()
variable. However, Stata gives you considerable flexibility in the or-
dering of the bars, as illustrated in the following examples using the
vg s2c
scheme.
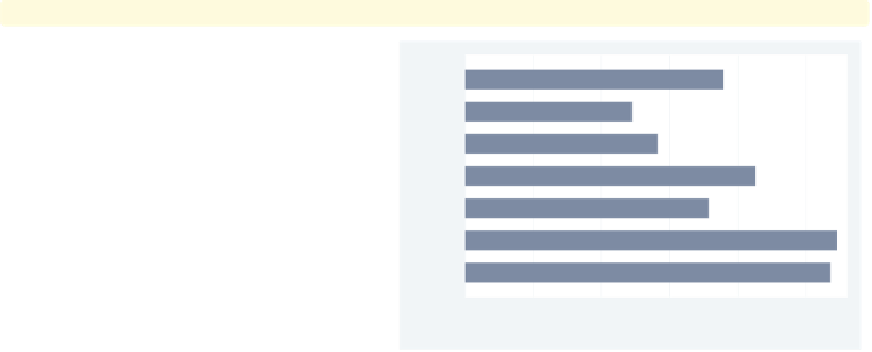
graph hbar wage, over(occ7,
descending
)
Consider this graph showing average
wages broken down by the seven levels
of occupation. The bars are normally
ordered by the levels of
occ7
, going
from 1 to 7, where 1 is Prof and 7 is
Other. Using the
descending
option
switches the order of the bars. They
still are ordered according to the seven
levels of occupation, but the bars are
ordered going from 7 to 1.
Uses nlsw.dta & scheme vg s2c
Other
Labor
Operat.
Cler.
Sales
Mgmt
Prof
0
2
4
6
8
10
mean of wage
The electronic form of this topic is solely for direct use at UCLA and only by faculty, students, and staff of UCLA.