Graphics Reference
In-Depth Information
3
Scatterplot matrix graphs
This chapter will explore the use of the
graph matrix
command for creating scatterplot
matrices among two or more variables. Many of the options that you can use with
graph
twoway scatter
apply to these kinds of graphs, as well; see
Twoway : Scatter
(35) and
Options
(235) for related information. This chapter illustrates the use of marker options
and marker labels, as well as options for controlling the display of axes. It also includes
options specific to the
graph matrix
command, as well as the use of the
by()
option. For
more details about scatterplot matrices, see [
G
]
graph matrix
.
3.1
Marker options
This section looks at controlling and labeling the markers in scatterplot matrices. This
section will show how to change the marker symbol, size, and color (both fill and out-
line color) and how to label the markers. You can label markers using the
graph matrix
command just as you could when using the
graph twoway scatter
command. See also
Options : Markers
(235) and
Options : Marker labels
(247) for more details. These examples
will use the
vg s1m
scheme.
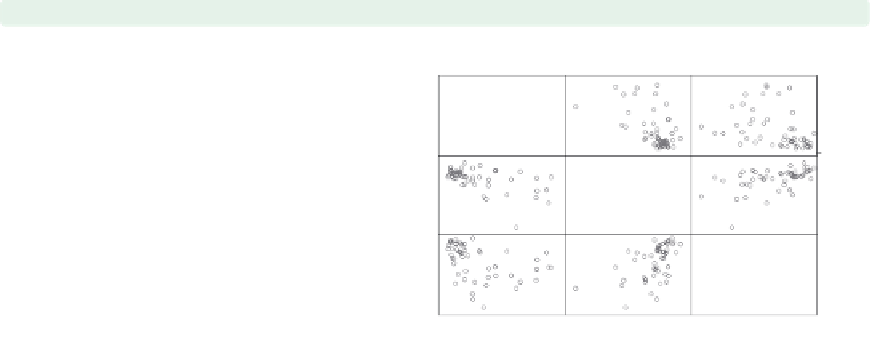
graph matrix propval100 ownhome borninstate,
msymbol(Oh)
You can control the marker symbol
with the
msymbol()
(marker symbol)
option. Here, we make the symbols
hollow circles. Other values that we
could specify include
D
(diamond),
T
(triangle),
S
(square), and
X
(x). Using
a lowercase letter (
d
instead of
D
)
makes the symbol smaller. For circles,
diamonds, triangles, and squares, you
can append an
h
(e.g.,
Oh
) to indicate
that the symbol should be hollow; see
Styles : Symbols
(342) for more
examples.
Uses allstates.dta & scheme vg s1m
40
60
80
100
% homes
cost
$100K+
50
0
80
% who
own
home
60
40
80
% born in
state of
residence
60
40
20
0
50
100
20
40
60
80
95
The electronic form of this topic is solely for direct use at UCLA and only by faculty, students, and staff of UCLA.