Graphics Reference
In-Depth Information
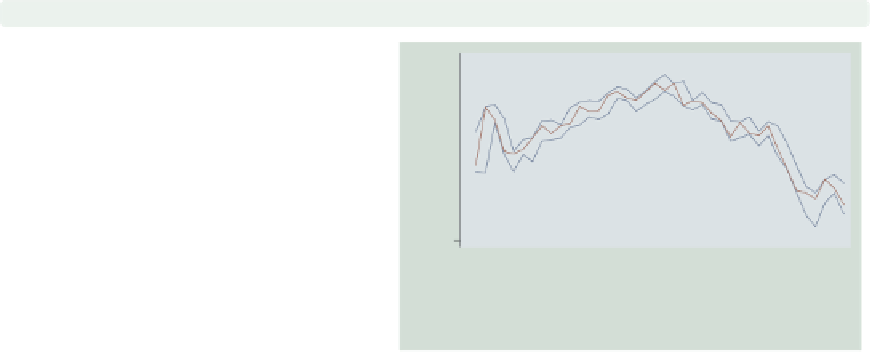
twoway line high low close tradeday, sort
clstyle(p1 p1 p2)
When we graph multiple
-variables, we
can use
clstyle()
(connect line style)
to control many characteristics of the
lines at once. Here, we plot the high
and low prices with the same style,
p1
,
and the closing price printed with a
second style,
p2
.
Uses spjanfeb2001.dta & scheme vg teal
y
1400
1350
1300
1250
1200
0
10
20
30
40
Trading day number
High price
Low price
Closing price
twoway line high low close tradeday, sort clstyle(p1 p1 p2)
clwidth(thick thick .)
Here, we combine
clstyle()
and
clwidth()
to make the lines for the
high and low prices the same style and
make them both thick. The third line is
drawn with the
p2
style, and the
thickness is left at its default value.
Uses spjanfeb2001.dta & scheme vg teal
1400
1350
1300
1250
1200
0
10
20
30
40
Trading day number
High price
Low price
Closing price
twoway (scatter propval100 urban) (lfit propval100 urban)
We return to the
allstates
data file.
We can overlay multiple twoway
graphs. Here, we show a common kind
of overlay: scatterplot overlaid with a
linear fit between the two variables.
Note that both the
scatter
command
and the
lfit
command are surrounded
by parentheses.
Uses allstates.dta & scheme vg teal
100
80
60
40
20
0
20
40
60
80
100
Percent urban 1990
% homes cost $100K+
Fitted values
The electronic form of this topic is solely for direct use at UCLA and only by faculty, students, and staff of UCLA.