Graphics Reference
In-Depth Information
twoway scatter propval100 rent700 urban,
mstyle(p2 p8)
The
mstyle()
(marker style) option
can be used to choose among marker
styles. These composite styles set the
symbol, size, fill, color, outline color,
and outline width for the markers.
Uses allstates.dta & scheme vg teal
100
80
60
40
20
0
20
40
60
80
100
Percent urban 1990
% homes cost $100K+
% rents $700+/mo
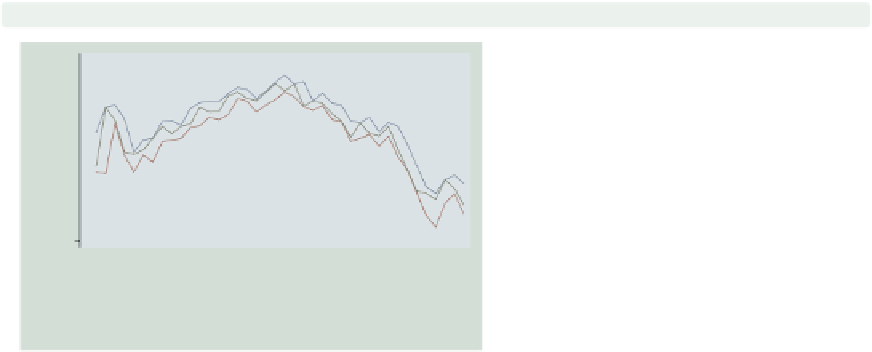
twoway line high low close tradeday, sort
We will briefly switch to using the
spjanfeb2001
data file. You can also
graph multiple
1400
y
-variables against a
1350
x
single
-variable with a line graph.
This works with
twoway line
,as
illustrated here, as well as with
twoway
connected
and
twoway tsline
.
Uses spjanfeb2001.dta & scheme vg teal
1300
1250
1200
0
10
20
30
40
Trading day number
High price
Low price
Closing price
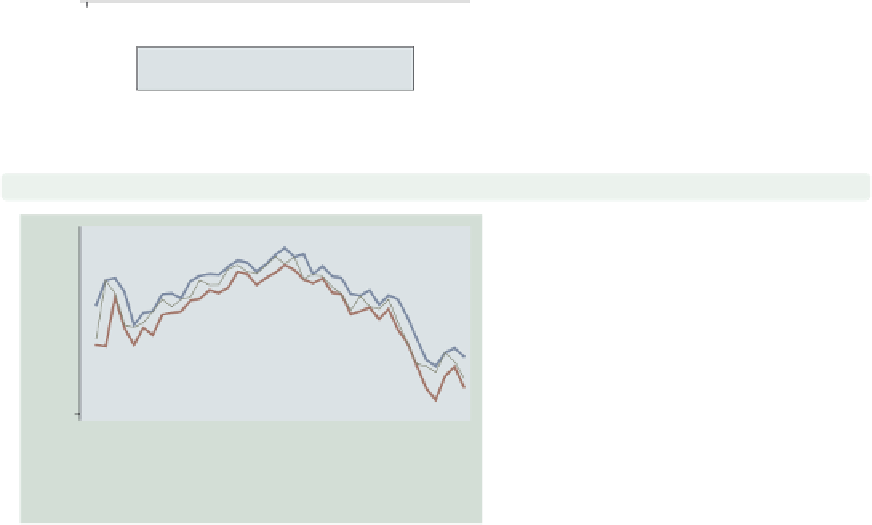
twoway line high low close tradeday, sort
clwidth(thick thick .)
Here, we use the
clwidth()
option to
change the width of the lines, making
the lines for the high and low prices
thick and leaving the line for the
closing price at the default width.
Uses spjanfeb2001.dta & scheme vg teal
1400
1350
1300
1250
1200
0
10
20
30
40
Trading day number
High price
Low price
Closing price
The electronic form of this topic is solely for direct use at UCLA and only by faculty, students, and staff of UCLA.