Graphics Reference
In-Depth Information
2.10
Overlaying plots
One of the terrific features of
twoway
graphs is the ability to overlay them, giving you
the flexibility to create more complex graphs. This section shows two strategies you can
use. The first strategy is graphing multiple
y
x
-variable in a sin-
gle
twoway
command. The second strategy is specifying multiple commands within a single
twoway
command, thus overlaying these graphs atop each other. It is also possible to create
separate graphs and glue them together using the
graph combine
command, which is dis-
cussed in
Appendix : Save/Redisplay/Combine
(358). We first start by illustrating how you
can specify multiple
-variables against a single
y
-variables against a single
x
-variable using a single
twoway
command.
twoway scatter propval100 rent700 urban
We can use
twoway scatter
to graph
multiple
100
y
-variables against a single
-variable in a single plot. Here, we
show
propval100
and
rent700
against
urban
. Note that we are now using the
vg teal
scheme.
Uses allstates.dta & scheme vg teal
x
80
60
40
20
0
20
40
60
80
100
Percent urban 1990
% homes cost $100K+
% rents $700+/mo
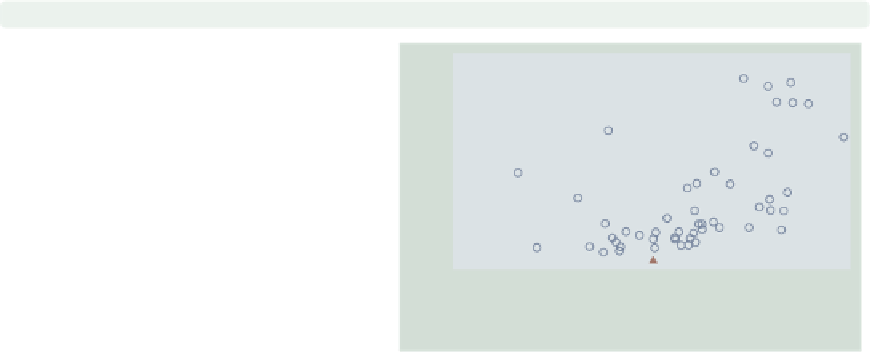
twoway scatter propval100 rent700 urban,
msymbol(Oh t)
The
msymbol()
option can be used to
select the marker symbols for the
multiple
100
-variables. Here, we plot the
variable
propval100
with hollow
circles, and
rent700
is plotted with
triangles.
Uses allstates.dta & scheme vg teal
y
80
60
40
20
0
20
40
60
80
100
Percent urban 1990
% homes cost $100K+
% rents $700+/mo
The electronic form of this topic is solely for direct use at UCLA and only by faculty, students, and staff of UCLA.