Biology Reference
In-Depth Information
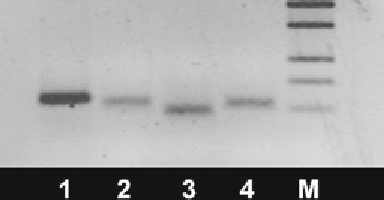
Fig.
3
Agarose gel showing DNA fragments specifi c to our PCR products ((1)
Drosha, 115 bp; (2) EIF2C1, 105 bp; (3) DGCR8, 93 bp; (4) TARBP2, 102 bp); the
right column
(M) shows the 100-bp DNA size standard
GAPDH
′
′
Forward 5
-TCACTGACAAAGAGAAGGCAGAGA-3
.
′
′
Reverse 5
-TCAGTGTGTCTGGTTCATTTCAGTT-3
.
3.4 Verifi cation
of the Amplifi cation
Products Using
Agarose Gel
Electrophoresis
DNA fragments can be separated according to their size using
agarose gels and an electric fi eld. The negatively charged phos-
phate groups of the DNA molecules migrate in the electrically
neutral agarose gel matrix toward the anode, and the smaller
fragments move more rapidly than the large fragments. The
accuracy of the PCR is evaluated by the size of the DNA
fragments:
1. 5
μ
l of the PCR products is mixed with 5
μ
l of gel loading
buffer.
2. A 100-bp DNA size standard (these DNA standards contain
DNA fragments of precisely defi ned sizes at intervals of 100 bp)
is applied to the 2 % agarose gel (1 % agarose, 1 % NuSieve
agarose, and 1× TAE buffer) (
see
Note 12
).
3. The electrophoresis is performed for 1 h at 175 V and 0.08 A.
The agarose gel is removed from the chamber and transferred
into a bowl containing the ethidium bromide solution for
15 min.
4. The DNA fragments are visualized under UV light and are
recorded (Fig.
3
).
For the relative quantitation of the PCR, the expression of the
target gene is correlated to a non-regulated homogeneously
expressed HKG or to an HKG index composed of several HKGs.
Different RNA extraction effi ciencies and errors in the reverse
transcriptase reaction are expected for every sample of both the
target gene and the HKG. Therefore, when calculating the differ-
ences in the expression of these genes, the individual sample effects
cancel each other out.
3.5 Calculating the
Results of the PCR
Using Relative
Quantifi cation