Biology Reference
In-Depth Information
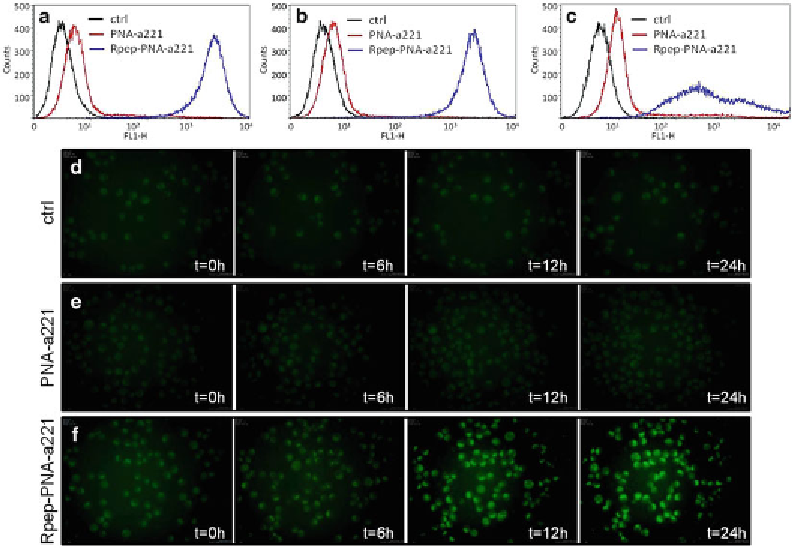
Fig.
1
FACS analysis after 12 h (
a
), 24 h (
b
), and 48 h (
c
) incubation of K562 cells in the absence (ctrl) or in the
presence of 2
M of the fl uorescein labeled Fl-PNA-a221 (
red lines
) and Fl-Rpep-PNA-a221 (
blue lines
)
molecules. (
d
-
f
) Intracellular distribution of Fl-PNAs. In this experiment, untreated cells (
d
) and cells treated
with 2
μ
M Fl-PNA-a221 (
e
) and Fl-Rpep-PNA-a221 (
f
) were analyzed using the Nikon BioStation IM, an inte-
grated cell incubator and fl uorescence camera system, 20i, magnifi cation, ×20. Pictures of cell culture were
taken at the start of treatment (
t
= 0) and after 6, 12, and 24 h, as indicated
μ
Fl-PNA-a221 and Fl-Rpep-PNA-a221 fl uorescent compounds.
The highest uptake is obtained when fl uorescein-labeled
Fl-Rpep-PNA-a221 is used (Fig.
1f
). A low level of fl uores-
cence is detectable with PNA-a221 (Fig.
1e
).
4. Confi rm uptake by FACS analysis after 24 h of treatment
(Fig.
2
) on human erythroleukemic K562 (Fig.
2a
), bronchial
epithelial IB3-1 (Fig.
2b
), breast cancer MCF-7 (Fig.
2c
), and
MDA-MB-231 (Fig.
2d
) cells: a good uptake can be obtained
in all the cell lines only by Fl-Rpep-PNA-a221 (
see
Notes 3
and
4
).
3.3 RNA Extraction
and Real-Time
Quantitative Analysis
of miRNA Expression
1. Trypsinize cells and collect by centrifugation at 1,600 ×
g
for
10 min at 4 °C, wash with PBS, lyse with Tri-Reagent
TM
,
according to manufacturer's instructions. Wash the isolated
RNA once with cold 75 % ethanol, dry and dissolve in nucle-
ase-free pure water before use.
2. For microRNA quantifi cation perform reverse transcriptase
(RT) reactions using the TaqMan
®
MicroRNA Reverse