Biology Reference
In-Depth Information
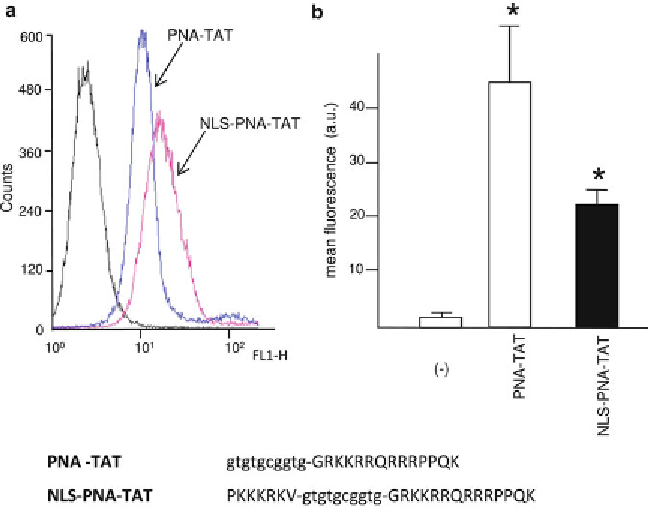
Fig.
2
FACS analysis showing the uptake of PNA-TAT and NLS-PNA-TAT after 48 h incubation of K562 cells in
the absence (
minus
) or in the presence of 2
M concentrations of the fl uorescein-labeled PNA-TAT ((
a
),
pink
line
), and NLS-PNA-TAT ((
a
),
blue line
) molecules. In (
b
) the quantitative determinations are shown. Sequences
of the PNA and peptides are also shown in the lower part of the panel.
Lower case letters
are employed for
PNA bases,
upper case letters
for amino acids
μ
3.7 Pri-miRNA and
miRNA Quantifi cation
1. Isolate RNA from K562 cells and measure it by reverse tran-
scription quantitative real-time polymerase chain reaction
(qRT-PCR) using gene-specifi c double fl uorescence labeled
probes. In the example reported an ABI Prism 7700
Sequence Detection System version 1.7.3 (Applied
Biosystems, Monza, Italy) was employed, according to the
manufacturer's protocols.
2. Use for each sample 20 ng of cDNA for the assays. All RT
reactions, including no-template controls and RT-minus con-
trols. Perform the experiment in duplicate.
3. Calculate the relative expression using the comparative cycle
threshold method and as reference U6 snRNA to normalize all
RNA samples, since it remains constant in the assayed samples
by miR-profi ling and quantitative RT-PCR analysis.
An example of pri-miR and miR quantifi cation is reported
in Fig.
3
, using PNA-peptide conjugates designed against
pre-miR-210.